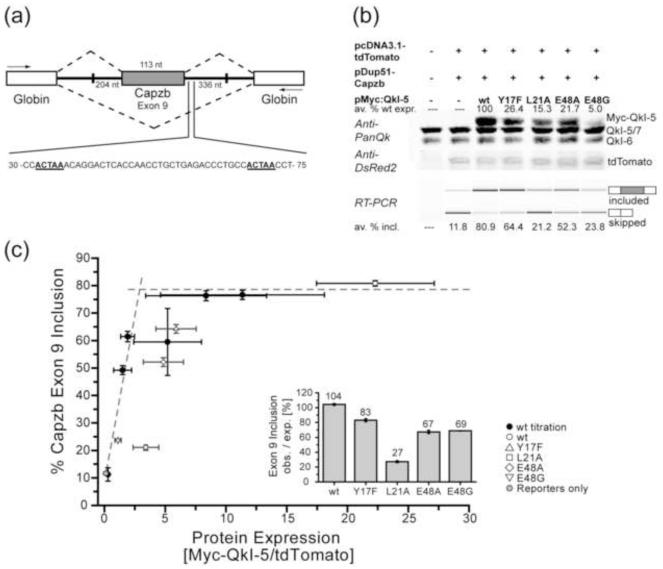
Figure 4. Dimerization-deficient point mutations in the Qua1 domain reduce QkI-5 splicing activity in vivo.
(a) Schematic presentation of the Capzb Exon9 mini gene organization. White boxes represent the Globin exons, the grey box represents the Capzb exon 9. Numbers by the introns flanking the Capzb Exon 9 indicate the length of intron sequence that was cloned from the Capzb gene. PCR primer positions are indicated as arrows. The 30-75 nt region downstream of the Capzb Exon 9 contains two QkI consensus binding sites, highlighted in bold and underscored, which are essential for QkI-5 splicing activity in C2C12 myoblast cells. (b) Western Blot (top) and RT-PCR analysis of QkI-5 expression levels and minigene splicing patterns from cytoplasmic RNA of C2C12 myoblast cells co-transfected with the Capzb Exon 9 minigene construct (pDup51-Capzb), plasmid for expression of wild type (wt) or mutant QkI-5 protein, and a tdTomato expression vector as transfection control. Each QkI-5 construct was assayed in three independent co-transfection experiments. In the Anti-PanQk blot, the two bottom bands represent endogenous QkI, while the top band represents the overexpressed Myc-QkI-5. The Anti-DSRed blot serves as transfection control. Average values for QkI-5 construct expression relative to wt expression are given above the Western blot. The average percentage of Capzb Exon 9 inclusion for each construct is given below the RT-PCR gel. Plots of these values including standard deviation can be found in Figure S5. (c) Capzb Exon 9 inclusion plotted versus protein expression levels. In order to normalize the splicing efficiencies of the QkI-5 mutants, which show very different protein expression levels, varying amounts of wt Myc-QkI-5 expression vector were transfected in three independent titration experiments. The protein expression level (normalized to tdTomato transfection control) and Capzb minigene splicing efficiency were analyzed as described for the QkI-5 mutants and plotted against each other. Plots of these values including standard deviation can be found in Figure S5. All individual data points were used to fit a simple saturation model (Figure S5). This plot shows the wt titration (black circles) and mutant (open symbols) data averaged over the three replicates. Error bars represent 1/2 standard deviation. The fitted saturation curve is presented as two intersecting dashed lines. Points falling below this curve indicate a lower splicing efficiency per QkI-5 molecule compared to wt, while the area above the curve indicates a higher splicing efficiency. The inset shows the ratio of observed to expected splicing efficiency (PSI, percent splicing included).

