Figure 4.
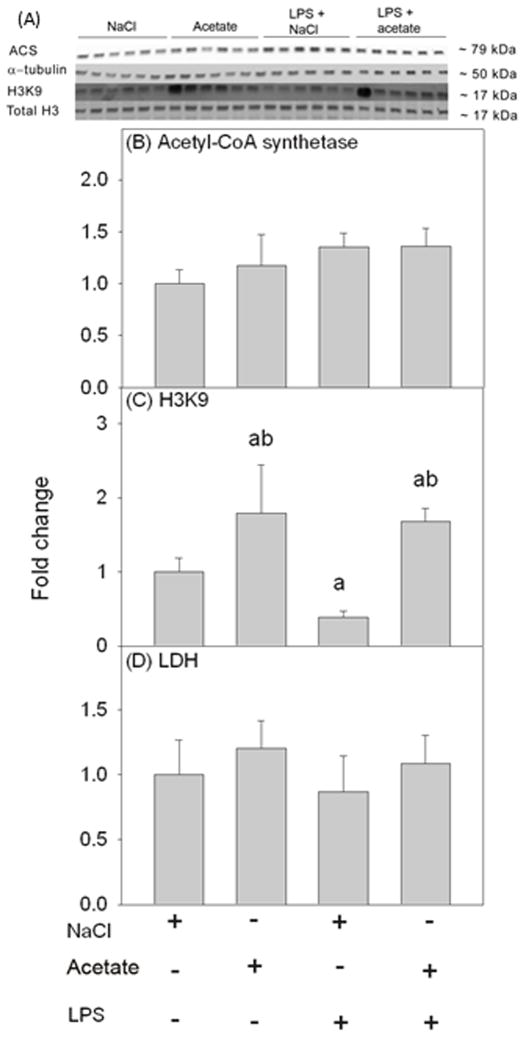
Changes in histone acetylation in BV-2 microglial cell culture stimulated for 4 hr with LPS 6.25 ng/ml, and the reversal of these effects upon treatment with 12 mM sodium acetate. Panel A shows representative images of the Western blots. Panels B and C show the optical densities of acetyl-CoA synthetase enzyme normalized to the loading control α-tubulin and H3K9 normalized to total H3, respectively (n = 6). Panel D shows the quantification of the ratio of secreted LDH in the media to total cellular LDH (n = 6). Bars represent means ± SD where statistical significance (a = compared to NaCl, and b = compared to LPS + NaCl) was set at p ≤ 0.05 (n = 6, per group), as determined by a one way ANOVA followed by Tukey’s post-hoc test.

