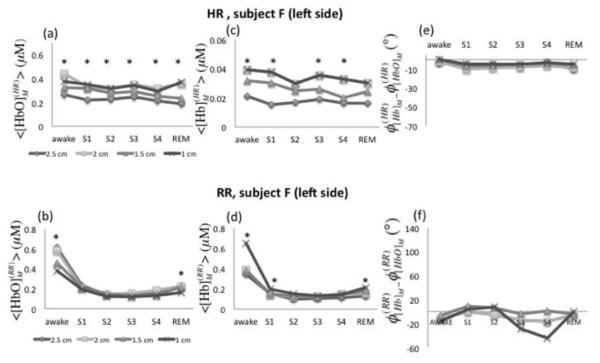
Fig. 10.
Amplitude and relative phase of measured [HbO] and [Hb] oscillation at the heart rate (HR: ~1 Hz) and respiratory rate (RR: ~0.3 Hz) at four source-detector separations of 1.0, 1.5, 2.0, and 2.5 cm. (a) [HbO]M, (b) [Hb]M and (c) φ[Hb] - φ[HbO] of measured oscillations at the heart rate as a function of sleep stages. (b) [HbO]M, (d) [Hb]M and (f) φ[Hb]-φ[HbO] of measured oscillations at the respiratory rate as a function of sleep stages. Different distance values are displayed with different symbols. The shortest (1 cm) and farthest (2.5 cm) source-detector separation distances were compared within each sleep stage by t and U2 tests (p < 0.05 indicated by *).

