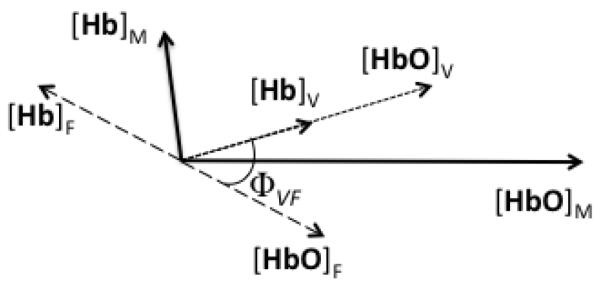
Fig. 3.
Phasor representation of low frequency oscillations (LFOs) of [HbO] and [Hb] associated with local blood flow velocity LFOs (subscript “F”) and local blood volume LFOs (subscript “V”), which combine by vector summation into the measured phasors of [HbO] and [Hb] (subscript “M”). In equations:, and. The angle is the [HbO]M = [HbO]F + [HbO]V, and [Hb]M = [Hb]F + [Hb]V. The angle ΦVF is the relative phase of blood volume vs. flow velocity LFOs.

