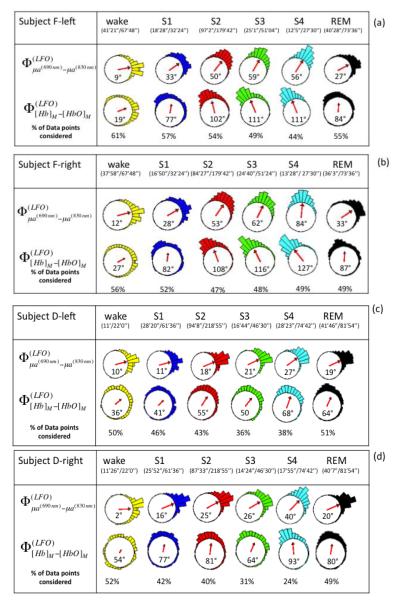
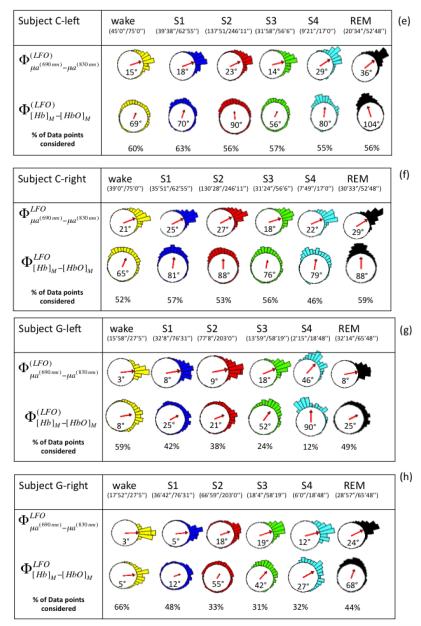
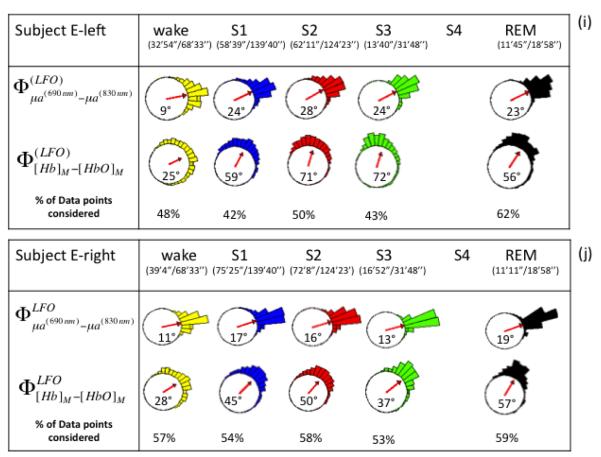
Fig. 4.
(a)-(j) Circular histograms and vector representation of the phase difference of μa690 vs. μa830 (φμa690-φμa830) and [Hb] vs. [HbO] (φ[Hb]-φ[HbO])) in the LFO frequency range for all subjects (F, D, C, G, E) during awake condition, non-REM sleep stages (S1, S2, S3, S4), and REM sleep. Vectors inside the circular histogram point to the average angles and their length is related to the variance of the distribution. Below each state (wake, S1, S2, S3, S4, REM), we report the time length of the data suitable for phase analysis and the total duration of that state. The percentage of points that fulfills the criteria for phase analysis is shown in the last row of each panel (% of data points condered). Data from the left and right sides for each subject are shown.


