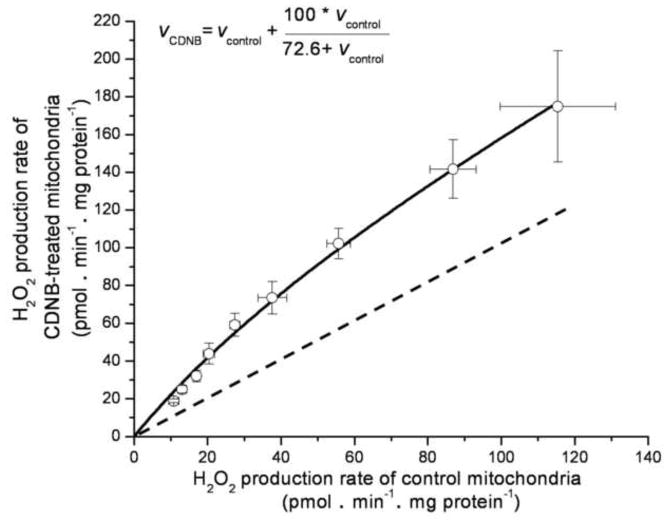
FIGURE 1. Comparison of rates of superoxide production (measured as H2O2 production) by site IF in CDNB-pretreated and control mitochondria.
Site IF was titrated by adding malate from 0.01 mM to 5 mM in separate runs followed by addition of rotenone. Points were fitted to give the parameter values in Eq. 1 (inset). The dashed line indicates a 1:1 relationship. Values are means ± SEM (n = 5).

