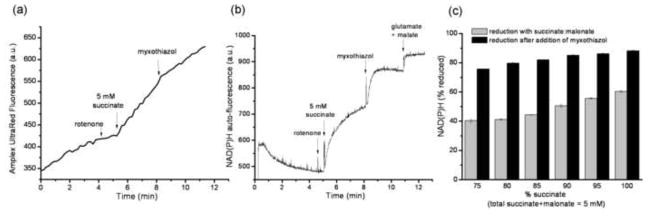
FIGURE 6. Contribution of site IF during calibration of site IIIQo.
For the calibration curve in Fig. 7c, the rate of superoxide production by site IIIQo was measured as myxothiazol-sensitive H2O2 production at different succinate:malonate ratios in the presence of rotenone. (a) Typical Amplex UltraRed fluorescence trace. 2 μM myxothiazol was added where indicated. (b) Corresponding NAD(P)H autofluorescence trace indicating that NAD(P)H becomes reduced under these conditions (5 mM glutamate plus 5 mM malate were added at the end to establish 100% reduction of the NAD(P)H pool. Therefore, correction for the changes in superoxide production from site IF before and after addition of myxothiazol was required. (c) The mean ± SEM reduction state of NAD(P)H at each succinate:malonate ratio in the absence and presence of 2 μM myxothiazol used to generate the correction using the IF calibration curve in Fig. 5c (n = 3).

