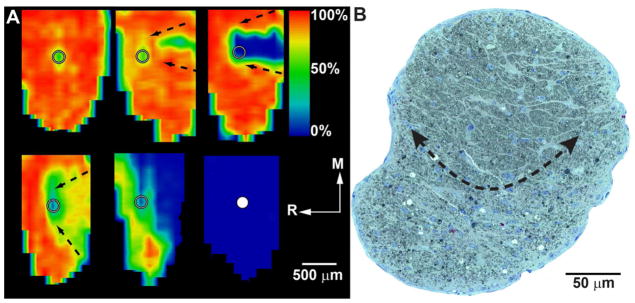
Figure 6. Sectorial Progression in the DBA Mouse.
A: Retinotopic maps of SC from DBA mice reconstructed from serial coronal sections showing levels of cholera toxin B transported from the retina after intravitreal injection. Degree of intact signal density varies from 100% (red) to 50% (green) to 0% (blue). Maps show the representation of optic disk gap (circle) and sectorial progression of deficits in transport increasing in severity from the caudal edge to the optic disk gap (arrows). Ages are (left to right, top to bottom): 3, 3, 8, 10, 10 and 12 months. R: rostral; M: medial. Maps reproduced from Crish et al. (2010). B: Cross-section through optic nerve of DBA mouse. Arrows outline a sector with advanced progression containing numerous degenerating profiles and extensive gliosis. The unaffected region of the nerve contains fascicles of intact axons separated by astrocyte processes.

