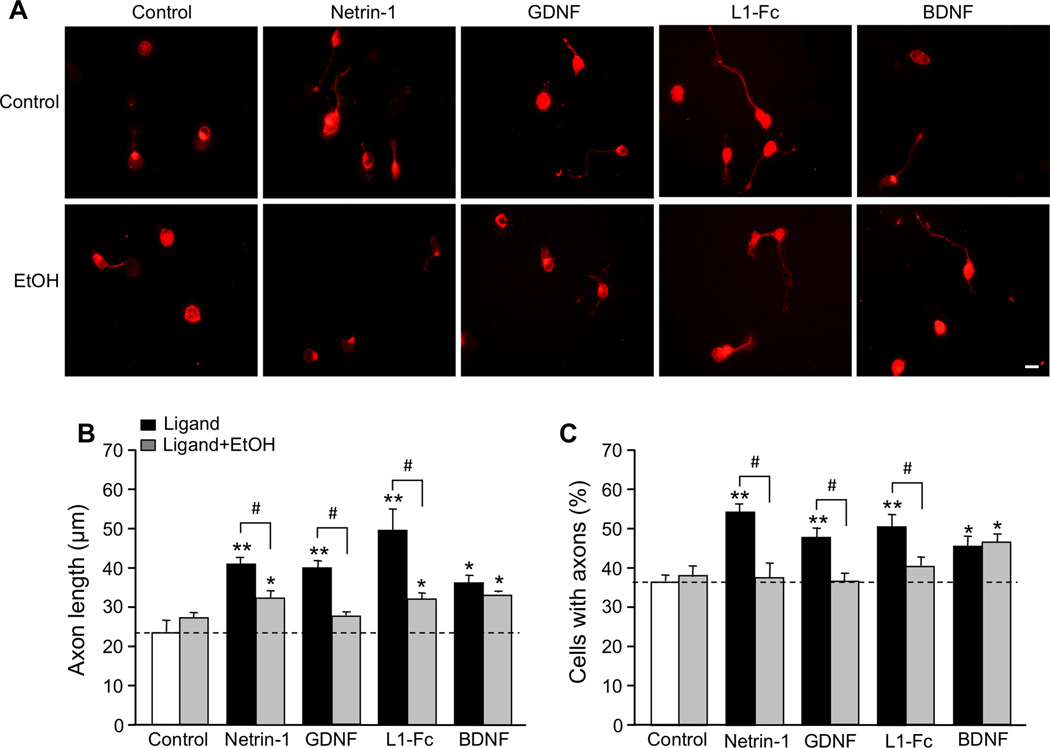
Figure 1. Effect of ligands and ethanol on axon outgrowth.
CGNs from PD7 rats were cultured under serum-free conditions for 20 hr in the absence and presence of 200 ng/ml netrin-1, 50 ng/ml GDNF, 10 µg/ml L1-Fc, 50 ng/ml BDNF, and 25 mM ethanol (EtOH)(same concentrations in all figures). A. Representative immunofluorescence micrographs of CGNs stained with Tau-1 antibody following different ligand treatments. Scale bar, 10 µm. B, C. Bars depict the mean ± SEM for (B) axon length of individual neurons (4–8 independent experiments); and (C) the percentage of neurons with neurites (4–9 independent experiments), following the indicated treatments. For both B and C: open bar, control; black bar, ligand; grey bar, ligand plus ethanol. * p < 0.05; ** p < 0.01; compared to untreated control; # p < 0.05 differences in the absence or presence of ethanol.

