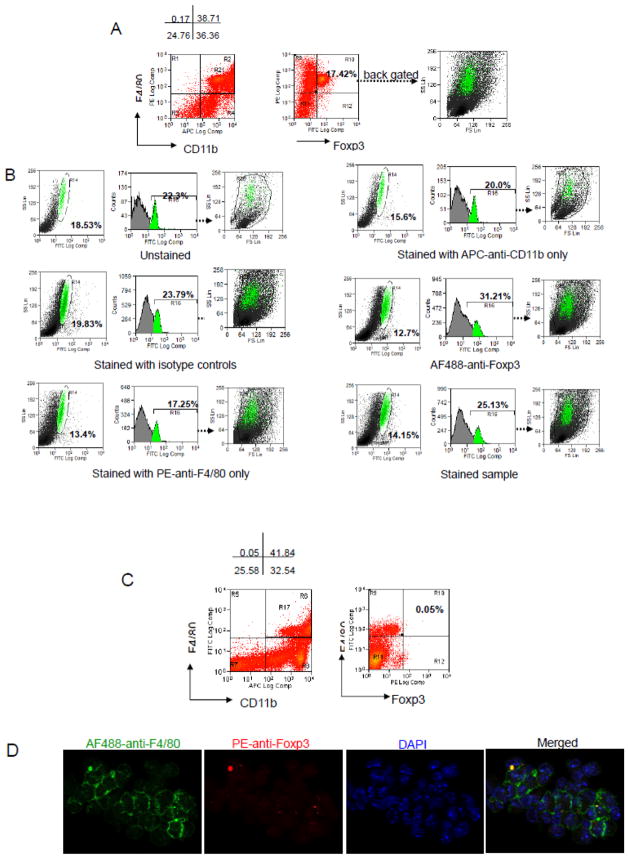
Figure 3. FACS analysis and fluorescent microscopy of “Foxp3 expression” in mouse peritoneal macrophages (PMφ).
(A) Cells were stained with APC-anti- CD11b, PE-anti-F4/80, and AF488-anti-Foxp3. CD11b+F4/80+ macrophage population was gated (R21 in Fig. 3A or R17 in Fig. 3C ). A discrete “Foxp3 falsepositive population” accounted for 17.42% of total PMφ cells were detected. (B) Unstained, Isotype, and single color stained controls of PMφ. Autofluorescencent population was detected in a subpopulation of PMφ in the SSC/FL1(AF488) plots, histogram plots of FL1(AF488), and the population was back gated in the FSC/SSC dot plot showing it had a higher side scatter(green dots). (C) Cells were stained with APC-anti-CD11b, AF488-anti-F4/80, and PE-anti-Foxp3, less autofluorescence in FL2(PE) channel was seen when using PE labeled anti- Foxp3 antibody. The remaining cells were DAPI-stained and representative images were taken; F4/80 (green), Foxp3 (red), and DAPI (blue). Data presented are from an individual C57 apoE(−/−) mouse with normal diet. Similar staining was observed in the other experimental group.

