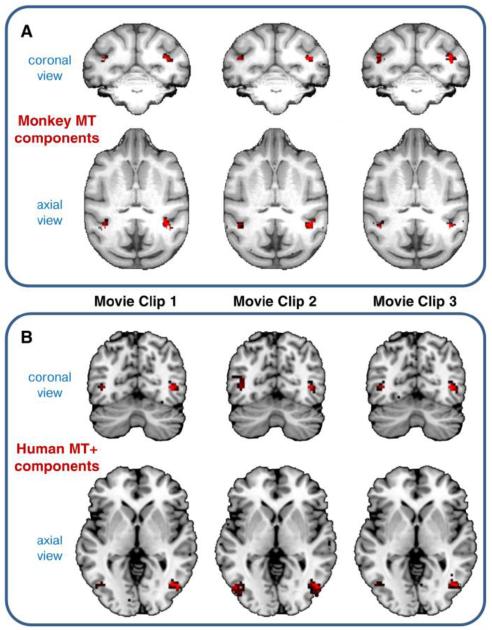
Figure 2. Example of monkey and human ICs detected for different movie clips.
Corresponding ICs from the three movie clips are clustered together by means of the sogICA approach. (A) Three monkey ICs mainly including the middle temporal area (monkey MT). (B) Three human ICs mainly including the middle temporal complex (human MT+). IC spatial maps are thresholded at Z>2 for visualization purposes.

