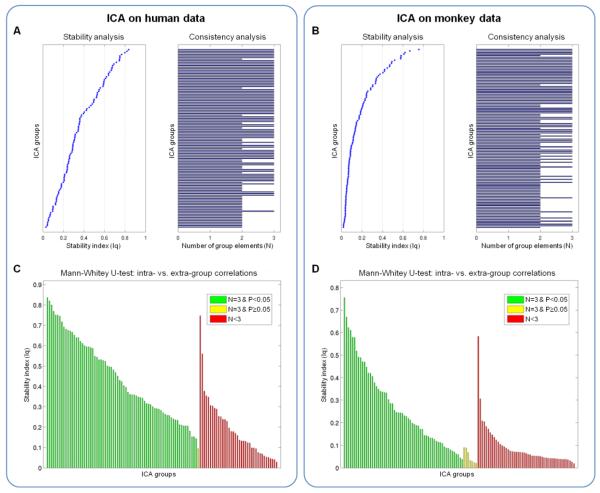
Figure 3. Analysis of ICA clusters from monkey and human data.
ICA decomposition was performed on monkey and human data, separately for each of the three movie clips. Spatial cluster analysis was performed, based on the self-organizing group ICA (sogICA) approach, to match corresponding ICs. Stability and consistency were assessed for all (A) monkey and (B) human ICA clusters. We measured the cluster stability as the difference between intra- and extra-cluster correlations, and the cluster consistency by the number of cluster elements (N ≤ 3). For inter-species comparisons, we selected the (C) monkey and (D) human ICA clusters with full consistency across movie clips (N=3) and with significant difference between intra- and extra-cluster correlations (Mann-Whitney U-test, P<0.05). The selected ICA clusters are colored in green.

