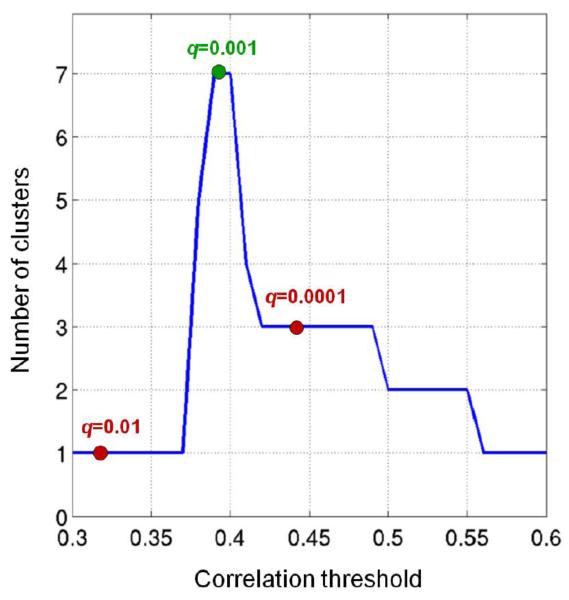
Figure 5. Analysis of correlation thresholds for the data-driven inter-species analysis.
The number of clusters containing monkey and human ICs is plotted for different values of the correlation threshold (assessed between 0.3 and 0.6 at steps of 0.01). The values for correlations corresponding to an FDR of q=0.01, q=0.001 and q=0.0001 are marked with a circle. The selected configuration (FDR of q=0.001) is indicated in green, the remaining ones in red.

