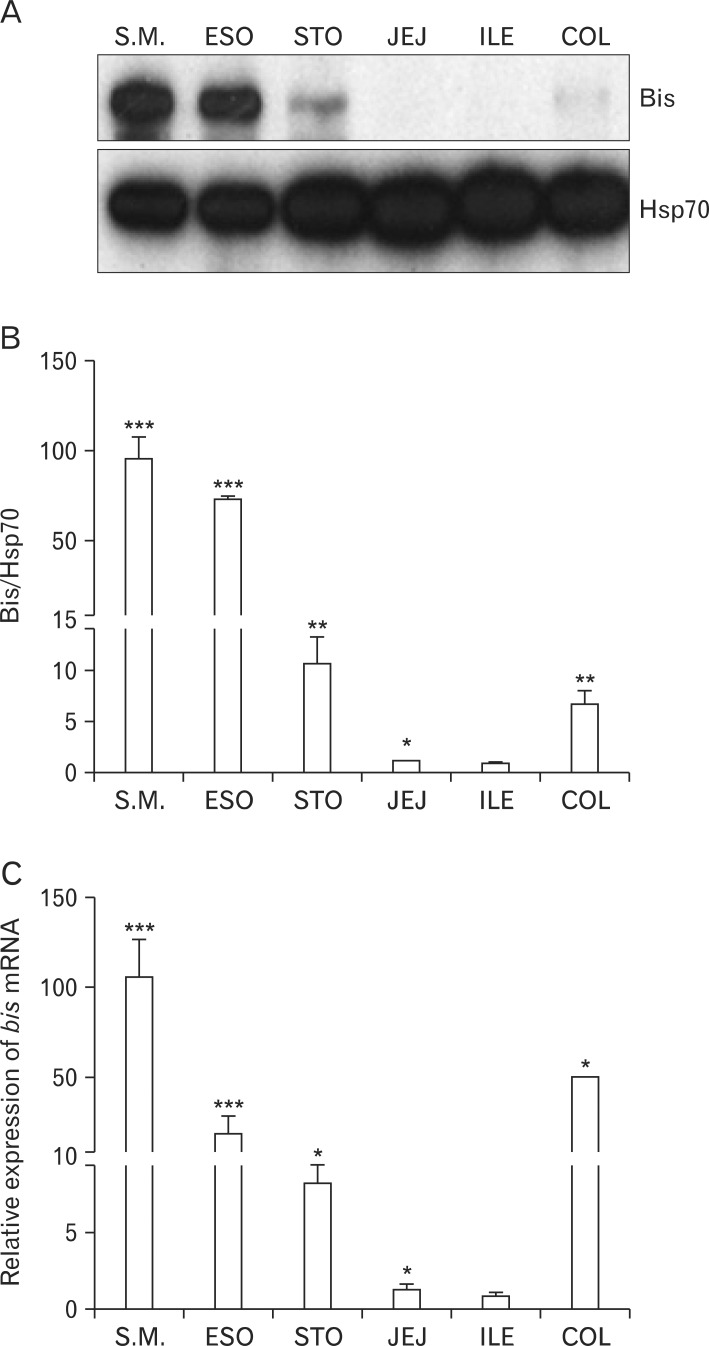
Fig. 1.
Expression of Bis in the mouse gastrointestinal (GI) tract. (A) Western blot analysis for Bis in the each part of GI tracts from 14-day-old mice. A representative result was provided with heat shock protein 70 (Hsp70) as a loading control. (B) A quantitative determination of Bis expression using densitometric analysis after normalizing to Hsp70 (mean±SE, n=3). The relative density of the Bis bands to that of Hsp70 from ileum was designated as 1.0. (C) Determination of the relative expression of bis mRNA in the mouse GI tract by quantitative real time polymerase chain reaction analysis. Data are normalized relative to β-actin mRNA in the same samples, and the value for the ileum was arbitrarily set as 1.0 (mean±SE, n=3). S.M., skeletal muscle; ESO, esophagus; STO, stomach; JEJ, jejunum; ILE, ileum; COL, colon. *P<0.05, **P<0.01 and ***P<0.005 compared with the value from ileum.

