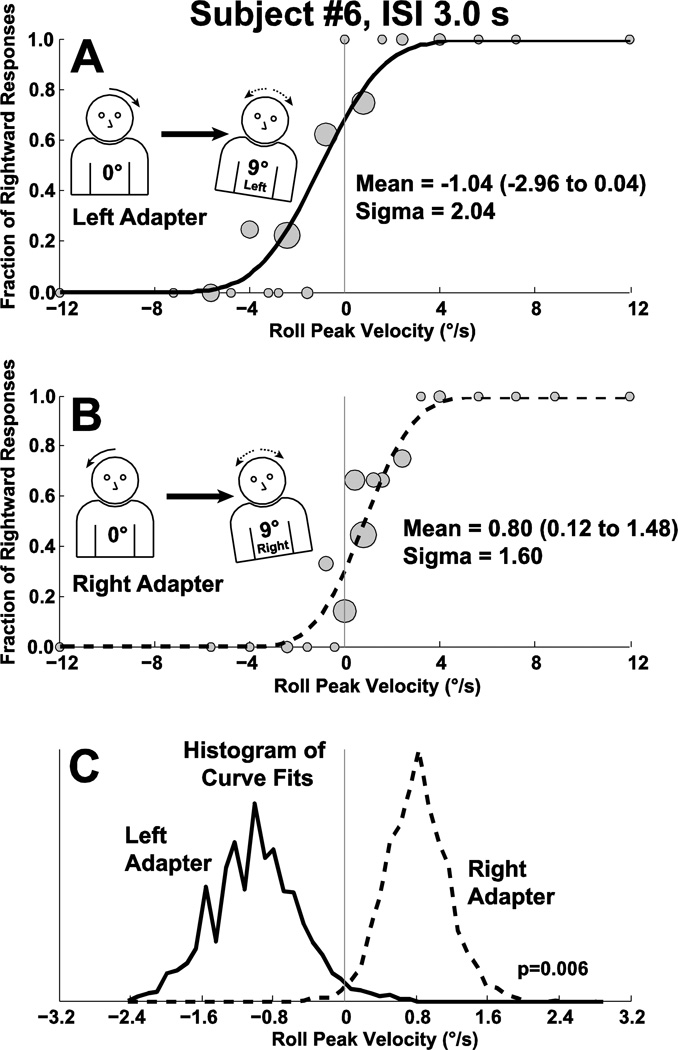
Figure 2.
A block of trials demonstrating the roll aftereffect in sample subject (#6) with an ISI of 3 s. Gray circles in panels A&B are sized proportionally to the number of responses they represent with the largest representing 9 and the smallest 1 stimulus presentation. Panel A: Best fit of a cumulative distribution function (CDF) to trials in which the adapting stimulus was to the left. The CDF is shifted to the left indicating that a neutral stimulus is more likely to be perceived as right. Panel B: The CDF fit to trials in which the adapting stimulus was roll to the right. A neutral stimulus is now more likely to be perceived as left. Panel C: The CDF was fit to the data in panels A&B after being randomly resampled 2,000×. The histograms of these fits are shown which demonstrates a significant difference between the two curves. The y-axis is of arbitrary units and is not labeled.

