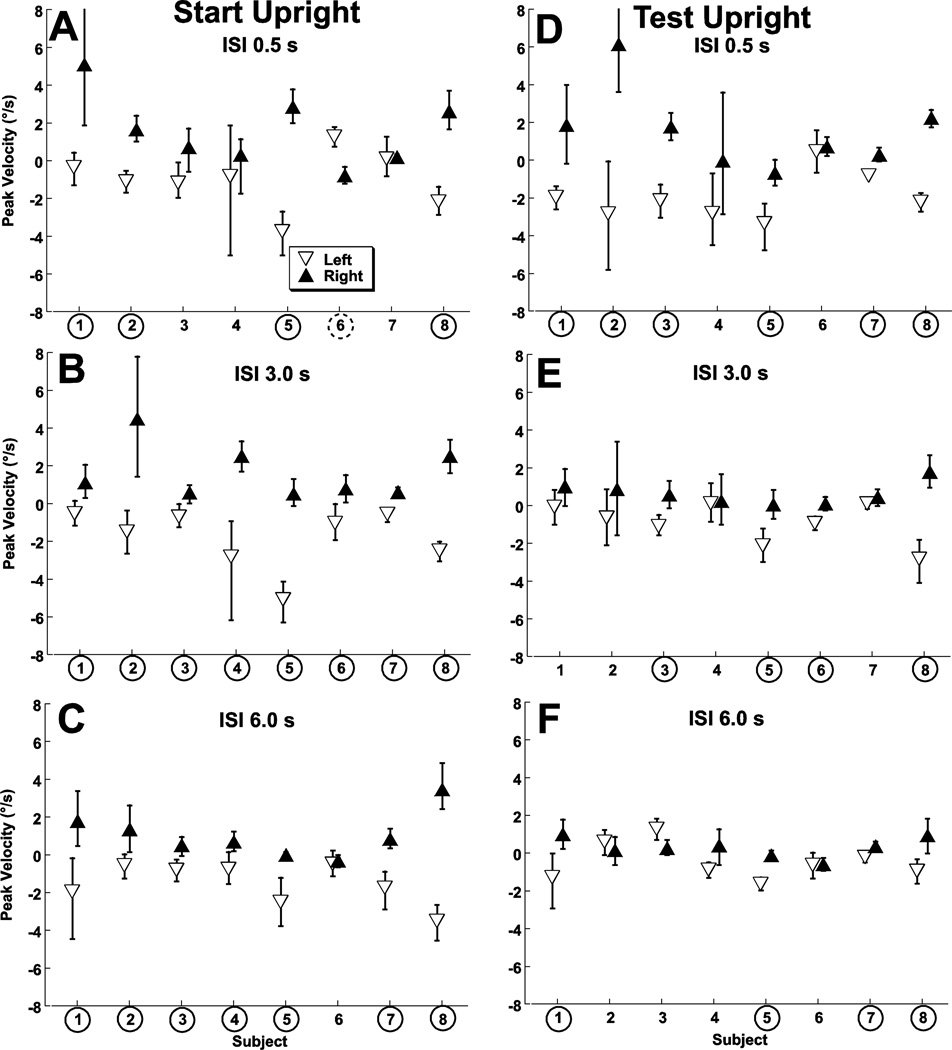
Figure 4.
The influence of an adapting stimulus on bias (i.e. the test stimulus velocity that is perceived as no motion) by subject. Subject numbers are circled if there was a significant difference in the bias based the direction of the adapting stimulus at the p < 0.01 level. This significant effect was almost always in the direction opposite the adapting stimulus but in one subject (dashed circle, panel A) was in the opposite direction. Error bars represent 95% confidence intervals.

