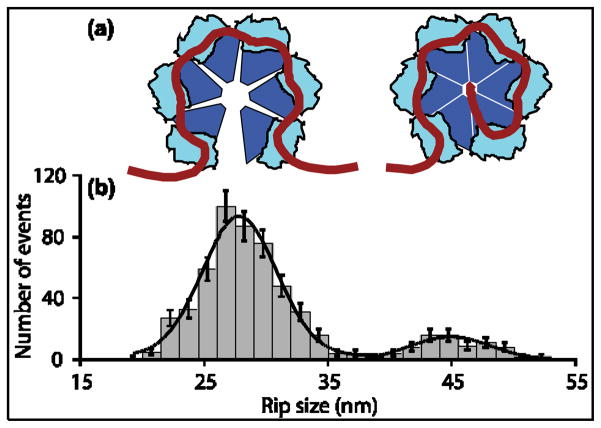
Figure 5. Two RNA Binding States of Rho.
(a) Diagram depicting the two Rho binding states consistent with the observed rips. Left: RNA bound to six Rho primary sites in its “open” configuration. Right: RNA bound to six primary sites plus the central secondary site in the “closed” configuration.
(b) Global histogram (grey bars) of the sizes of RNA-release rips observed in the presence of ATP or AMP-PNP for all templates studied (N =570). Solid line: Fit to sum of two Gaussians, with peaks at 28 ±1 nm and 45 ±1 nm (mean ± S.E.M.). Data from populations centered at 56 nm and 84 nm(Fig. 3) were included in the global dataset by dividing the measured values by 2 or 3, respectively (see text).

