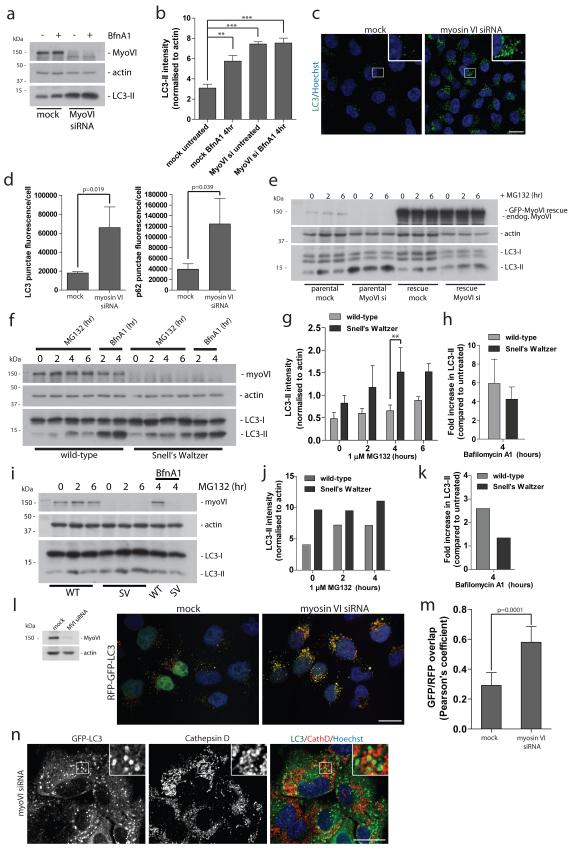
Figure 1. Loss of myosin VI function leads to an accumulation of autophagosomes.
(a) Western blot analysis of myosin VI depleted Hela cells untreated or treated with 100 nM Bafilomycin A1. (b) Quantitation of Western blot LC3-II intensity (+/− s.d.) (n=3). **p<0.01, ***p<0.001 (c) Confocal immunofluorescence microscopy of LC3 punctae (green) in Hela cells following knockdown of myosin VI. Hoechst labels nuclei (blue). Scale bar, 20 μm. (d) Quantitation of LC3- and p62-positive punctae was performed and results are represented as average punctae fluorescence intensity/cell (+/− s.d.) (n=3) from >1500 cells/experiment. (e) Western blot analysis of parental Hela cells or Hela cells stably expressing siRNA resistant GFP-myosin VI transiently transfected with a single myosin VI siRNA oligonucleotide following treatment with 1 μM MG132. (f) Western blot analysis of mouse embryonic fibroblasts cultured from wild-type and Snell’s Waltzer (SV) mice treated with 1 μM MG132 or 100 nM Bafilomycin A1. (g) Quantitation of Western blot LC3-II intensity (+/− s.d) (n=3). **p<0.01. (h) To evaluate effects on autophagosome biogenesis, results are displayed as the fold increase in normalised LC3-II intensity with Bafilomycin A1 compared to untreated control. (+/− s.d.) (n=3) (i) Western blot analysis of cortical neurons from wild-type and SV mice treated with 1 μM MG132 in the absence or presence of 100 nM BafilomycinA1. (j) Quantitation of Western blot LC3-II intensity was performed. (n=2) (k) To evaluate effects on autophagosome biogenesis, results are displayed as fold increase in normalised LC3-II intensity with Bafilomycin A1 compared to untreated control. (n=2) (l) Confocal immunofluorescence microscopy of mock or myosin VI siRNA treated Hela cells stably expressing RFP-GFP-LC3 reporter. Hoechst labels nuclei (blue). (m) Quantitative data of RFP and GFP signal overlap from confocal images of mock or myosin VI siRNA treated Hela cells expressing RFP-GFP-LC3. Data is represented as the Pearson’s coefficient of RFP and GFP signal correlation from >100 cells/experiment. (+/− s.d.) (n=3) Scale bar, 20 μm. (n) Confocal immunofluorescence microscopy of myosin VI depleted RPE cells stably expressing GFP-LC3 immunostained against GFP (green) and Cathepsin D (red). Hoechst labels nuclei (blue). Insets represent magnified boxed regions. Scale bar, 20 μm.

