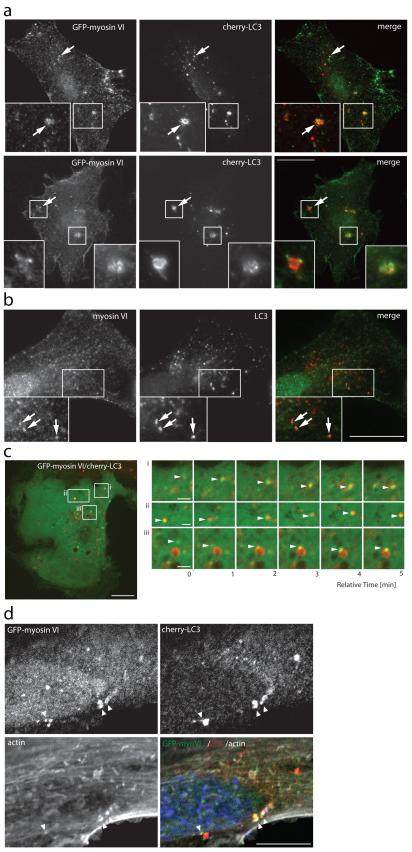
Figure 3. Myosin VI localises to LC3-positive autophagosomes.
(a) RPE cells transiently cotransfected with GFP-myosin VI and cherry-LC3 and either left untreated (top row) or treated with 250 nM Torin1 for 2 hours (bottom row) were processed for immunofluorescence microscopy. Arrows highlight areas of colocalisation and inserts provide higher magnification of boxed regions. Scale bar, 20 μm. (b) RPE cells treated with 100 nM BafilomycinA1 were processed for immunofluorescence microscopy to evaluate endogenous myosin VI and endogenous LC3 colocalisation. Arrows highlight areas of colocalisation. Scale bar, 20 μm. (c) Image stills acquired from spinning disk time-lapse video microscopy of RPE cells transiently cotransfected with cherry-LC3 and GFP-myosin VI. Boxed regions highlight areas of interest within the cell that are shown to the right (i, ii, iii) as video image stills captured at 1-minute intervals. Arrowheads highlight myosin VI positive vesicles (green) coming into contact and colocalising with LC3-positive vesicles (red). Scale bar, 10 μm (whole cell image), 2 μm (cropped images). (d) Confocal immunofluorescence microscopy of RPE cells stably expressing cherry-LC3 following transient transfection with GFP-myosin VI. Immunostaining for GFP (green) and cherry (red) was performed and actin was visualised with phalloidin (white). Nuclei were labelled with Hoechst (blue). Arrowheads indicate areas of actin rich myosin VI/LC3-positive autophagosomes. Scale bar, 20 μm

