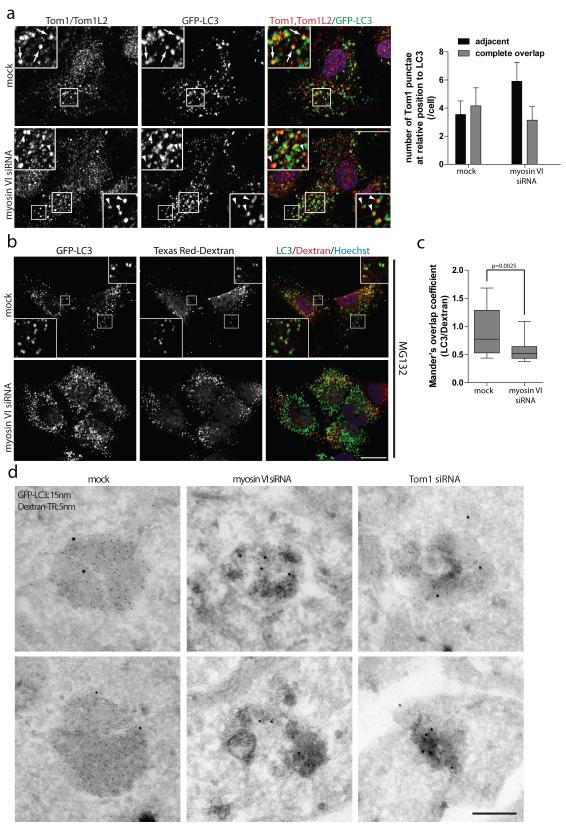
Figure 8. Myosin VI mediates delivery of endocytic cargo to autophagosomes.
(a) RPE cells with stable expression of GFP-LC3 following mock or myosin VI siRNA transfection were processed for confocal immunofluorescence microscopy and immunolabelled for Tom1/Tom1L2 (red). Nuclei (blue) were labeled with Hoechst. Inserts provide higher magnification of boxed regions and arrows highlight areas of complete overlapping colocalisation and arrowheads highlight adjacent localisation of Tom1 relative to LC3. Scale bar, 20 μm. Quantitation was performed on >75 cells for the relative position (adjacent or complete overlap) of Tom1-positive vesicles in relation to LC3-positive vesicles. Results are represented as the average number of Tom1-positive vesicles/cell categorised by their relative position to LC3 (+/− s.d.) (n=3). (b) GFP-LC3 expressing RPE cells were depleted of myosin VI by siRNA. Cells were pulse labeled with Texas Red Dextran (red) for 4 hours, prior to chase into fresh media containing 1 μM MG132 for 2 hours. Cells were processed for immunofluorescence microscopy and immunostained for GFP (green). Nuclei were labeled with Hoechst (blue). Insets represent higher magnification of boxed regions. Scale bar, 20 μm. (c) Mander’s overlap coefficients for the degree of LC3 signal colocalising with Dextran were calculated using Volocity software. Results represent >20 cells from n=3 independent experiments and are illustrated as a box and whisker plot. Box represents median, 25th and 75th percentiles and whiskers represent max and min. (d) RPE cells stably expressing GFP-LC3 were depleted of myosin VI and Tom1 by siRNA. Cells were pulse-labelled with Texas-Red Dextran for 16 hours followed by a chase period of 4 hours. Cells were processed for immunoelectron microscopy and labeled with 15 nm gold particles against GFP-LC3 and 5 nm gold particles against Texas Red-Dextran. Scale bar, 200 nm.

