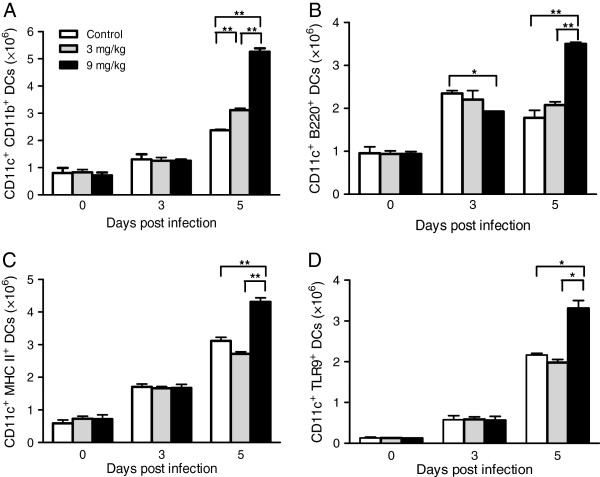
Figure 5.
Effects of allicin treatments on DCs during P. yoelii 17XL infection. Representative graphs show the absolute numbers of cells in the spleens for (A) mDCs, (B) pDCs, and (C) CD11c+ MHCII+ DCs, (D) CD11c+ TLR9+ DCs on day 0, 3, and 5 PI. The cells were quantified by flow cytometry analysis and data presented as the mean ± standard error (n = 3 mice/group). Results are representative of three independent experiments. Error bars represents SEM. Asterisks indicate statistically significant differences (*: P < 0.05; **: P <0.01) between groups.

