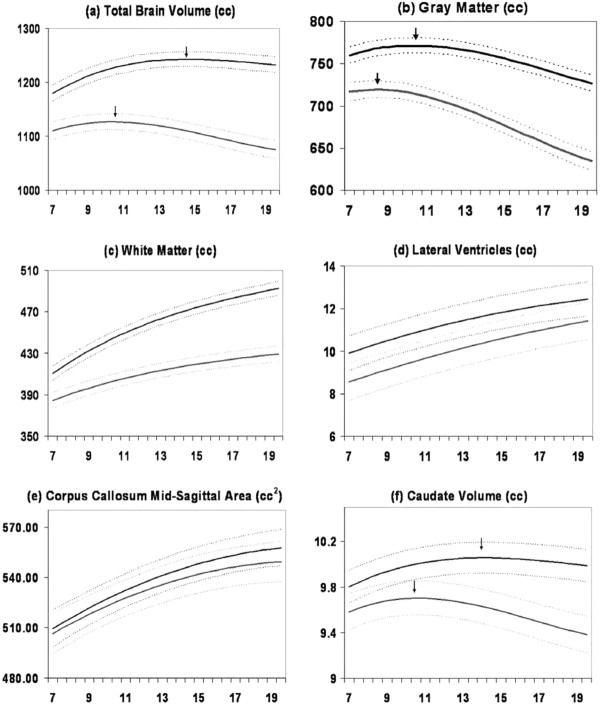
Figure 1.
Mean volume by age in years for males (N = 475 scans) and females (N = 354 scans). Middle lines in each set of three lines represent mean values, and upper and lower lines represent upper and lower 95% confidence intervals. All curves differed significantly in height and shape. Figure adapted from Lenroot et al. (2007).

