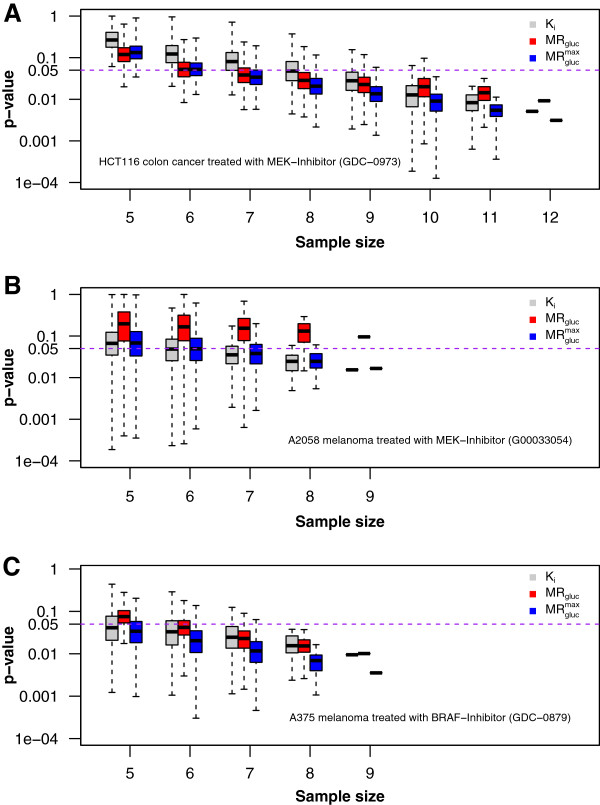
Figure 1.
Experimental statistical power at day 7 post-dose. Three panels correspond to three animal models from Table 2. Each shows Student's t-test results from treatment comparisons of control and treatment groups of mice as a function of sample size and using three PET metrics. (A) HCT116 colorectal cancer in Nu/Nu mice. (B) A2058 melanoma cancer in Nu/Nu mice; (C) A375 melanoma cancer in Nu/Nu mice. Results were calculated for the full group size of n animals and for all possible combinations of individuals (limited to a maximum of 4,000 random samples) studied in four progressively smaller subsets (x-axis). The y-axis (log10 scale) indicates the significance level p-value. The purple dashed line indicates a significance level of 0.05. Every boxplot includes a bold horizontal line that indicates the median p-value. The box length shows the interquartile range (25% to 75%), and the whiskers show minimum and maximum observed p-values.

