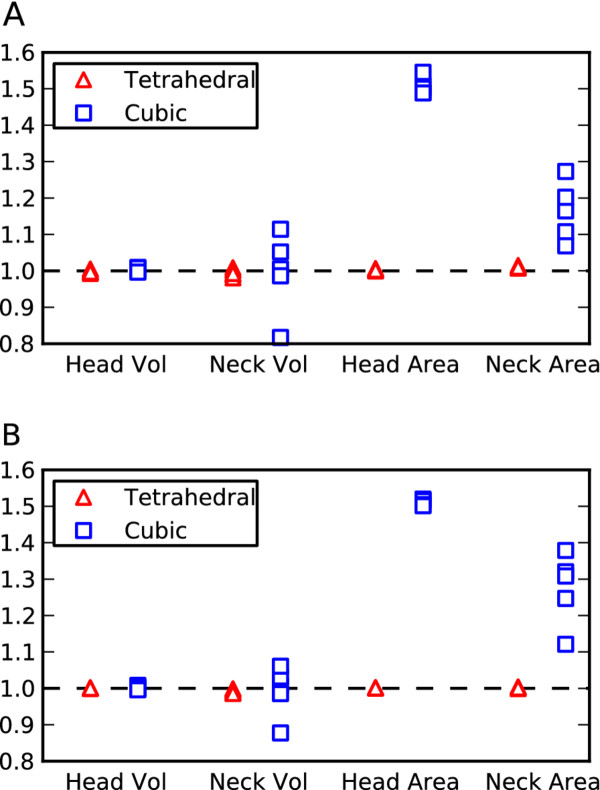
Figure 5.
Comparison between cubic and tetrahedral spine meshes. A scatter plot of the properties of the tetrahedral meshes (red triangles; many points overlap) and the cubic meshes (blue squares; some overlap) representing geometry which consists of a spherical head joined to a cylindrical neck to approximate dendritic spines. All properties were plotted as a ratio of measured value/ideal value. A. The coarsest meshes ranging from approximately 2500–3000 subvolumes per mesh. B. The more detailed meshes ranging from approximately 11000 to 16000 subvolumes per mesh.

