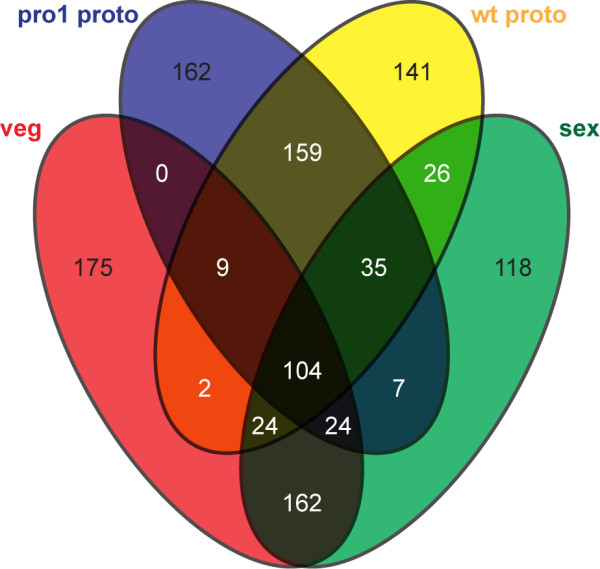
Figure 6.

Venn diagram of geneswith top 500 readcounts for each sample. Numbers of genes that are in the top 500 group for one or more or the four samples (vegetative mycelium, sexual mycelium, wild-type protoperithecia, pro1 protoperithecia) are given. In this analysis, only reads that map within 100 to 400 bases from the 3’ end of the mRNA were used to account for the 3’ bias in the microdissection samples and different mRNA lengths. An analysis using read counts for complete predicted mRNAs gave similar results (data not shown).
