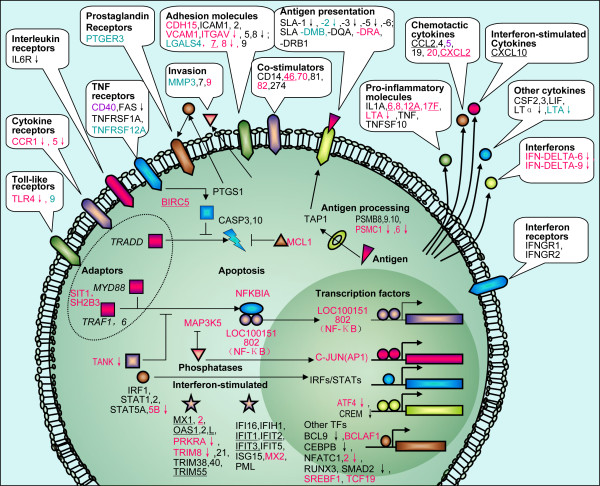
Figure 3.
Immune response of IPEC-J2 cells 3 h after infection. A graphical representation of a robust response to infection was adapted from [40,41]. Genes that were differentially expressed in the IPEC-J2 cells upon different ETEC strains infection are illustrated. Further differentiating was that genes responded to the F4ab ETEC infection only are in blue colour, to F4ac ETEC only are in black, to F18ac ETEC only are in purple, to both F4ac ETEC and F18ac ETEC are in black with underline, to both F4ab ETEC and F4ac ETEC are in red without underline, and to all of the three strains are in red with underline. Genes marked with a downward arrow were down-regulated and the others up-regulated.

