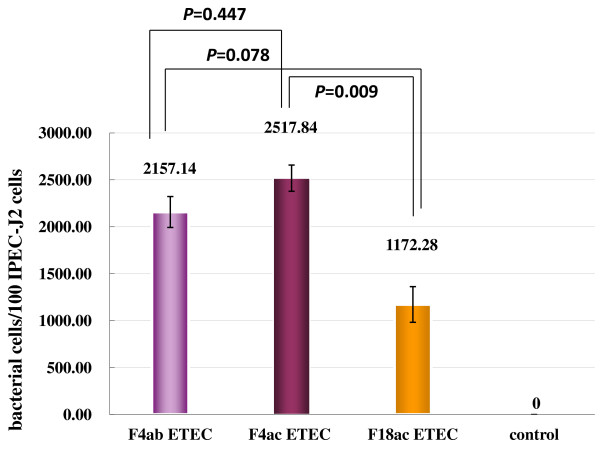
Figure 4.
Adhesion of the three different ETEC strains to IPEC-J2 cell monolayers as evaluated by real-time PCR. The numbers given above the columns represent means ± standard deviation. The data reported represent the mean values obtained in 3 independent experiments. Each experiment was performed in triple. P: significant level of t-test.

