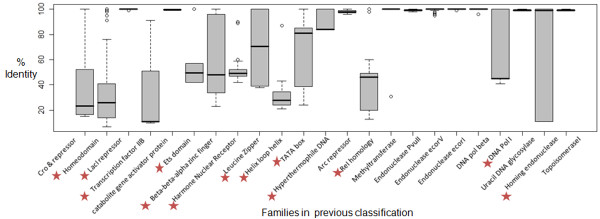
Figure 4.
Percentage Identity distribution for Thornton’s families. Pairwise percent identity distribution for 23 multi-member Thornton families. (Red stars in front of the family name implies it has wide distribution of percent identity and further the family was subjected to Jack-knifing for selecting the representative).

