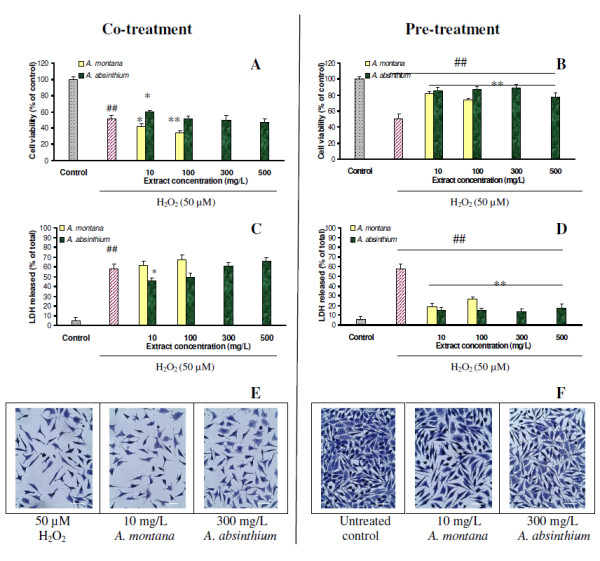
Figure 2 .

Viability of NCTC cells after co-treatment (A, C) and pre-treatment (B, D) with plant extracts at various concentrations, analyzed by Neutral red (A, B) and LDH (C, D) assays. Results are represented as mean ± SD (n = 6). ##p < 0.01 compared with untreated control (dotted); *p < 0.05 and **p < 0.01 compared with H2O2-treated group (striped). Micrographs taken at 24 h after H2O2-treatment showed the morphology of cells after co-treatment (E) and pre-treatment (F) with 10 mg/L A. montana extract and 300 mg/L A. absinthium extract. Scale bar = 10 μm.
