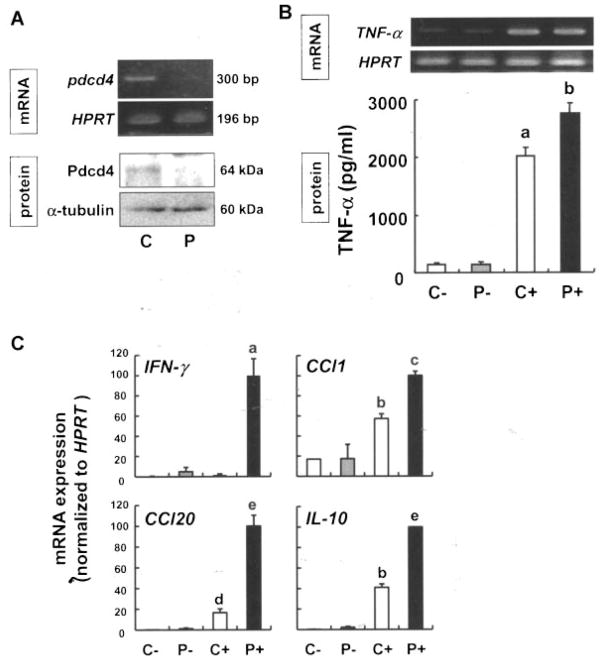
Figure 5.
Knockdown of Pdcd4 increases expression of proinflammatory genes. (A) RAW264.7 macrophages were transfected with the control (C) or Pdcd4 (P) siRNA using Lipofectamine 2000 in OPTI-MEM, and recovered in DMEM containing 10% FBS for 24 h. Total RNA and protein were extracted for RT-PCR and Western blot analysis, respectively. (B) After recovery, cells were exposed to vehicle or LPS (100 ng/mL) for 6 h then the total RNA and supernatants from the cell cultures were subjected to RT-PCR and ELISA, respectively. C−, control siRNA-transfected cells; P−, Pdcd4 siRNA-transfected cells; C+, control siRNA-transfected cells; P+, Pdcd4 siRNA-transfected cells incubated with LPS. Each value represents the mean ± SD of three separate experiments. Student’s t-test was used to determine significant differences. aP <0.001 versus control siRNA without LPS, bP <0.05 versus control siRNA with LPS. (C) To verify the results obtained from the PCR array analysis (Supplementary Table 1), expression levels of INF-γ, Ccl-1, Ccl-20, and IL-10 were semi-quantified by real-time RT-PCR, and HPRT served as the internal standard. Each value represents the mean ± SD of three separate experiments. Student’s t-test was used to determine significant differences. aP <0.01 versus control siRNA with LPS, bP <0.005 versus control siRNA without LPS, cP <0.001 versus control siRNA with LPS, dP <0.05 versus control siRNA without LPS, eP <0.005 versus control siRNA with LPS.

