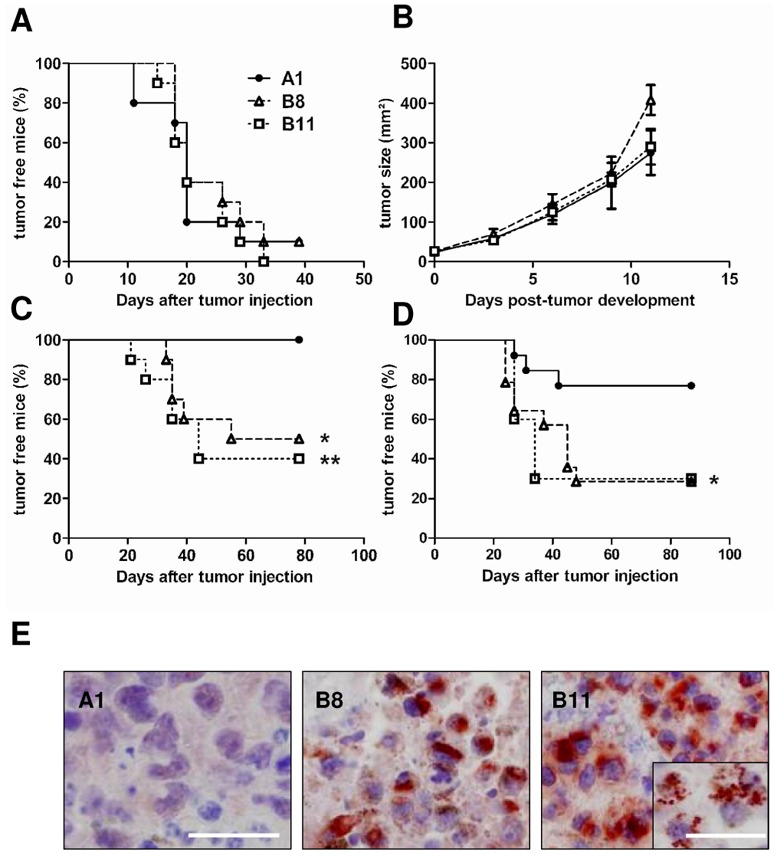
Figure 2. Resistance to immune rejection of IL4I1-expressing tumors.

(A and B) 103 tumor cells were injected s.c. into the left flank of naïve C57BL/6 mice (n = 10 mice/group, representative experiment out of 2). (A) The survival without tumor and (B) tumor growth were evaluated twice a week during forty days after challenge. (C and D) Mice were vaccinated s.c. with GP33. (C) Seven or (D) 28 days later, 105 tumor cells were injected s.c. into the controlateral flank. (C) Representative experiment out of 5 with n = 10 mice/group and (D) representative experiment out of 3 with n = 14 mice/group. Curve comparison was performed using the Log-Rank test, A1 ●; B8 △; B11 □. (C); B8 vs B11, NS. *p=0.012; **p=0.004 (D) A1 vs B8 or vs B11, *p = 0.049. (E) IL4I1 immunostaining on tumor sections. Slices from formalin-fixed paraffin-embedded A1, B8 and B11 tumors were stained with an anti-IL4I1 antibody. Magnification x400, scale bar = 100 μm; inset magnification x630, scale bar = 50 μm.
