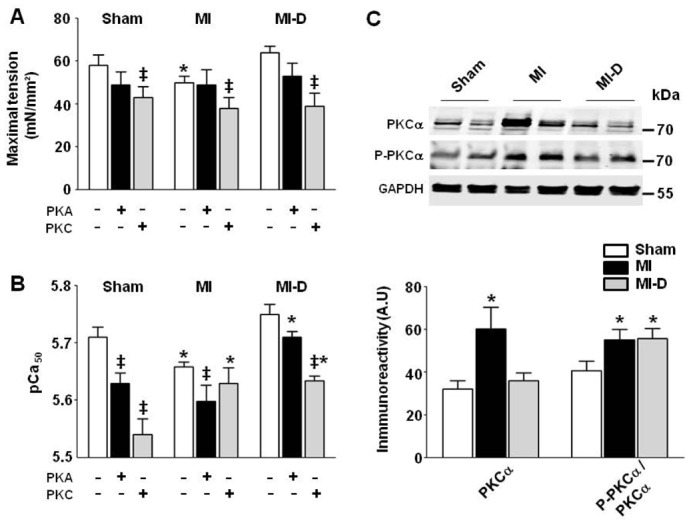
Figure 6. Effects of delapril on contractile machinery in permeabilized cardiomyocytes: involvement of the PKA and PKC pathways.

A. Maximal tension developed by isolated Sham (n=12), MI (n=9) and MI-D (n=9) cardiomyocytes, under control conditions and after PKA or PKC incubation. B. The pCa50 developed by isolated cardiomyocytes under control conditions and after PKA or PKC incubation. C. Top panel: representative Western blot for PKCα, P-PKCα and GAPDH; Molecular Weight in kDa. Bottom panel: PKCα expression levels, relative to GAPDH content, and P-PKCα/PKCα ratio. Results are expressed as means ± S.E.M (n=5 mice). *P<0.05 in comparison with Sham mice with the same treatment (panel C). ‡ P<0.05 in comparison with non-treated cells within each group.
