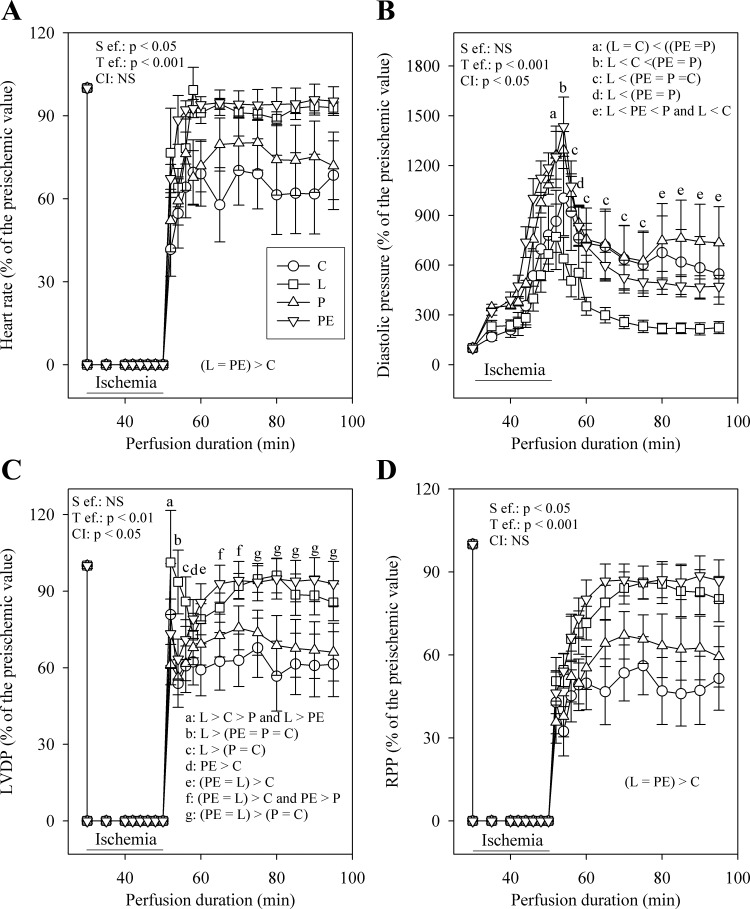
Fig. 5.
Progression of heart rate (A), diastolic pressure (B), LVDP (C), and RPP (D) during perfusion with control, lactate-rich, pyruvate-rich, and pyruvate plus ethanol-rich media. The number of experiments was 10 per group. a,b,c,d,e,f,gP < 0.05, different letters indicate significant differences as represented in each panel. Statistical analyses were performed only for the reperfusion period.

