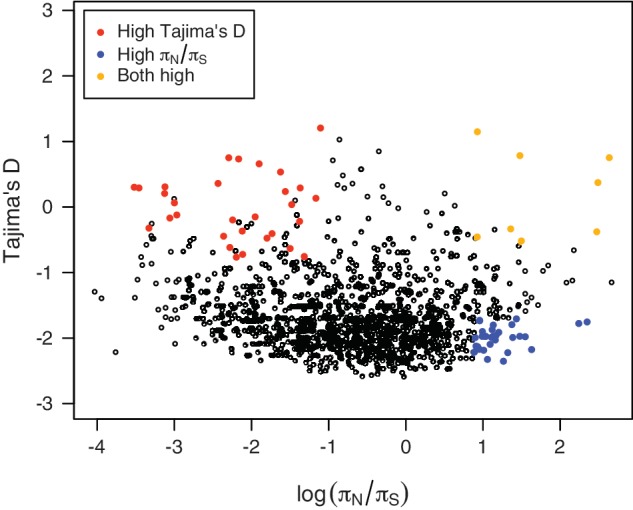
Fig. 3.

Tajima’s D versus log(πN/πS). Tajima’s D and πN/πS do not always have the same pattern. By considering both together, genes under selection can more readily be identified. Orange dots show genes with both high Tajima’s D (P value < 0.05) and πN/πS (top 5%), red dots show genes with only high Tajima’s D, and blue dots represent genes with only high πN/πS.
