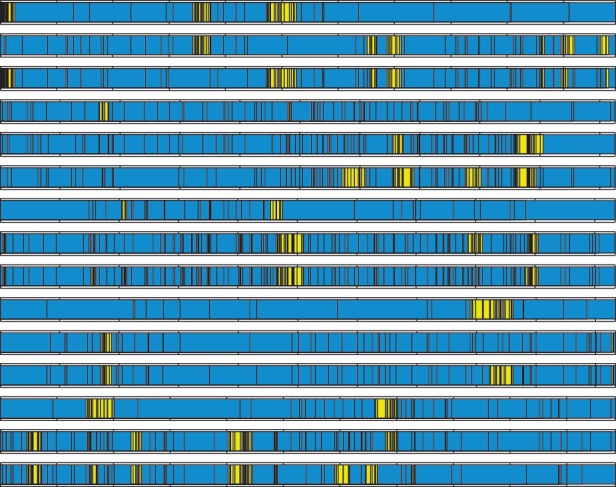
Fig. 4.

The most likely conversion tracts from Model 4. The 15 high-identity VSG alignments are listed in the order (1,2), (1,3), (2,3) for each triplet. The bars refer to mismatches between nucleotides in the N-domains of the two sequences. The most likely conversion tracts (highlighted in yellow) were estimated by the “decoding” algorithm using the means of the posteriors in table 1. Between-conversion regions are given in blue.
