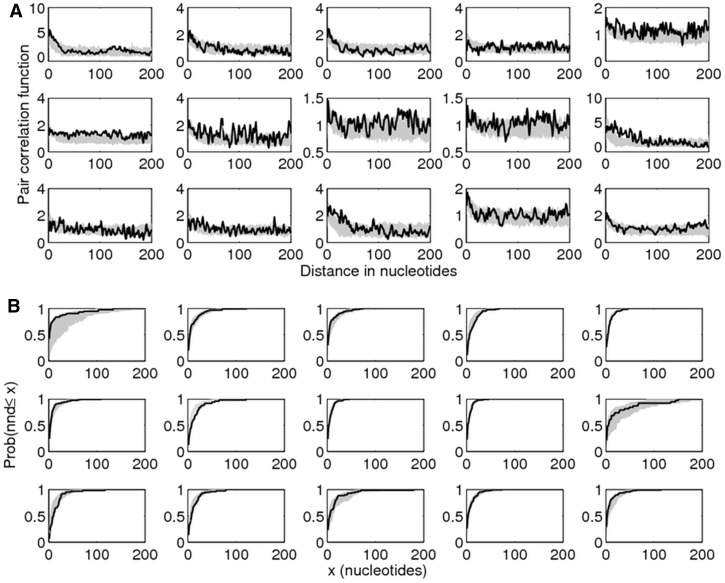
Fig. 5.
Goodness-of-fit tests for Model 4 using higher order statistics. (A) Pair correlation functions, denoting the density g(r) of mismatches at distance r from each other (supplementary material SI6, Supplementary Material online). (B) Cumulative next-mismatch distance distribution. The gray shaded area represents 95% credibility intervals for the modeled mismatch patterns (100 replicates, with mean estimates for each parameter as in table 1). The lines represent the respective statistics of observed mismatches from the data set. The panels show the VSG gene pairs in the order 1–5 (row 1), 6–10 (row 2), and 11–15 (row 3).

