Figure 4.
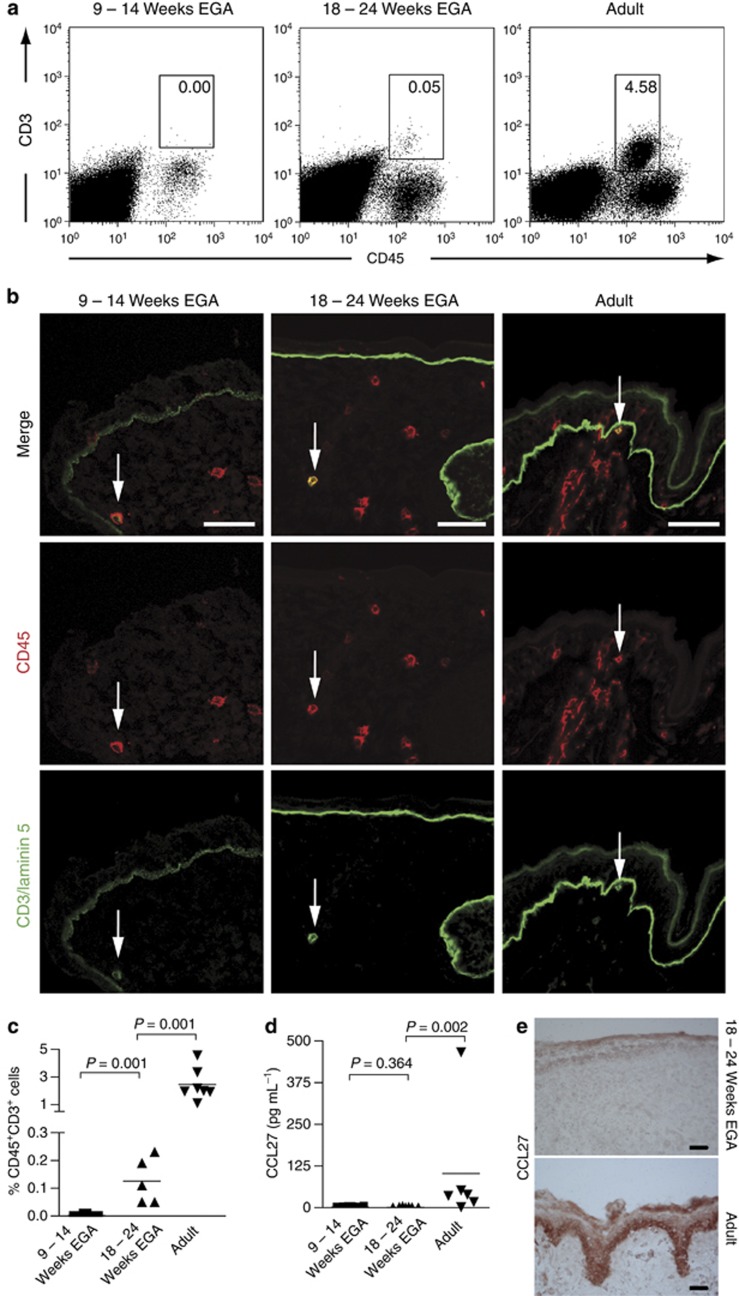
Skin T cells can be identified at midgestation. (a) Multiparameter flow cytometric analysis was performed after incubation with mAbs against the cell surface markers indicated. Gates in dot plots were set according to isotype-matched control staining. Dead cells were excluded by 7-amino-actinomycin-D uptake. Dot plots are representative of 5–8 experiments. (b) Immunofluorescence double staining was performed on cryostat sections of embryonic, fetal, and adult skin. One of at least three experiments per group is shown. Arrows denote CD45+CD3+ T cells. (c) Graphs show an increase of T-cell numbers in developing prenatal skin analyzed by flow cytometry (n=5–8). (d) Single cell suspensions of embryonic, fetal, and adult skin were cultured for 48 hours, supernatants were harvested, and CCL27 levels were analyzed by ELISA. Bars represent the mean. (e) Immunohistochemical staining was performed on cryostat sections of fetal and adult skin, and CCL27 binding was visualized using amino-ethyl-carbazole. Bars=50 μm. EGA, estimated gestational age.

