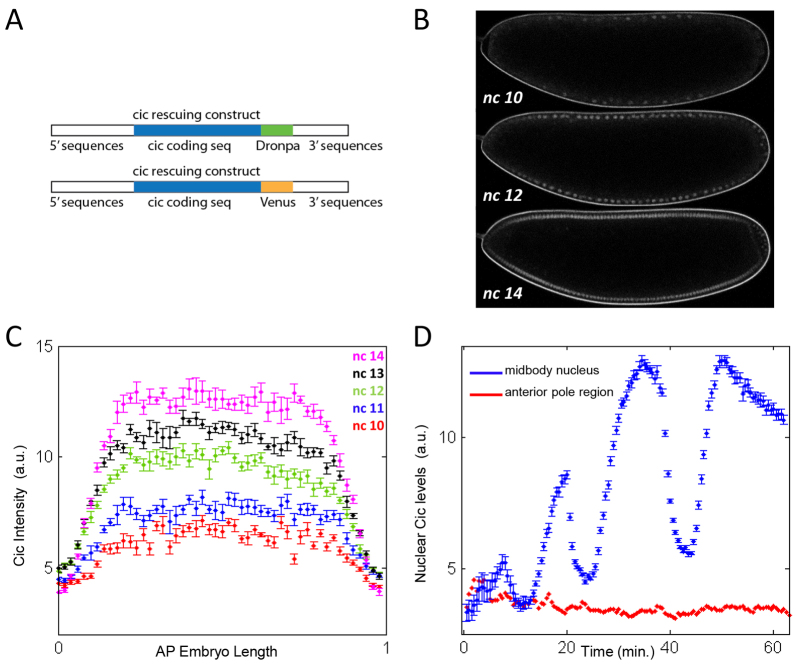
Fig. 1.
Dynamics of Cic in the early Drosophila embryo. (A) Schematics of the fusion constructs. Cic is fused to Dronpa or Venus and flanked by the endogenous 5′ and 3′ regulatory regions. Both constructs rescue sterility of females homozygous mutant for Cic. (B) Live imaging of Cic-Dronpa embryos at different nuclear division cycles. Cic levels are low at the poles and high in the mid-body of the embryo. (C) Quantified average intensity profiles of Cic along the AP axis from cycle 10 interphase (red) to ~15 minutes into cycle 14 interphase (magenta). Error bars correspond to s.e.m. based on five embryos. (D) Dynamics of the nuclear levels of Cic in the middle of the embryo (blue) and at the anterior pole (red) as a function of time; t=0 corresponds to nuclear cycle 10 mitosis. Error bars are s.e.m. for 50 nuclei within the mid-body of the same embryo.

