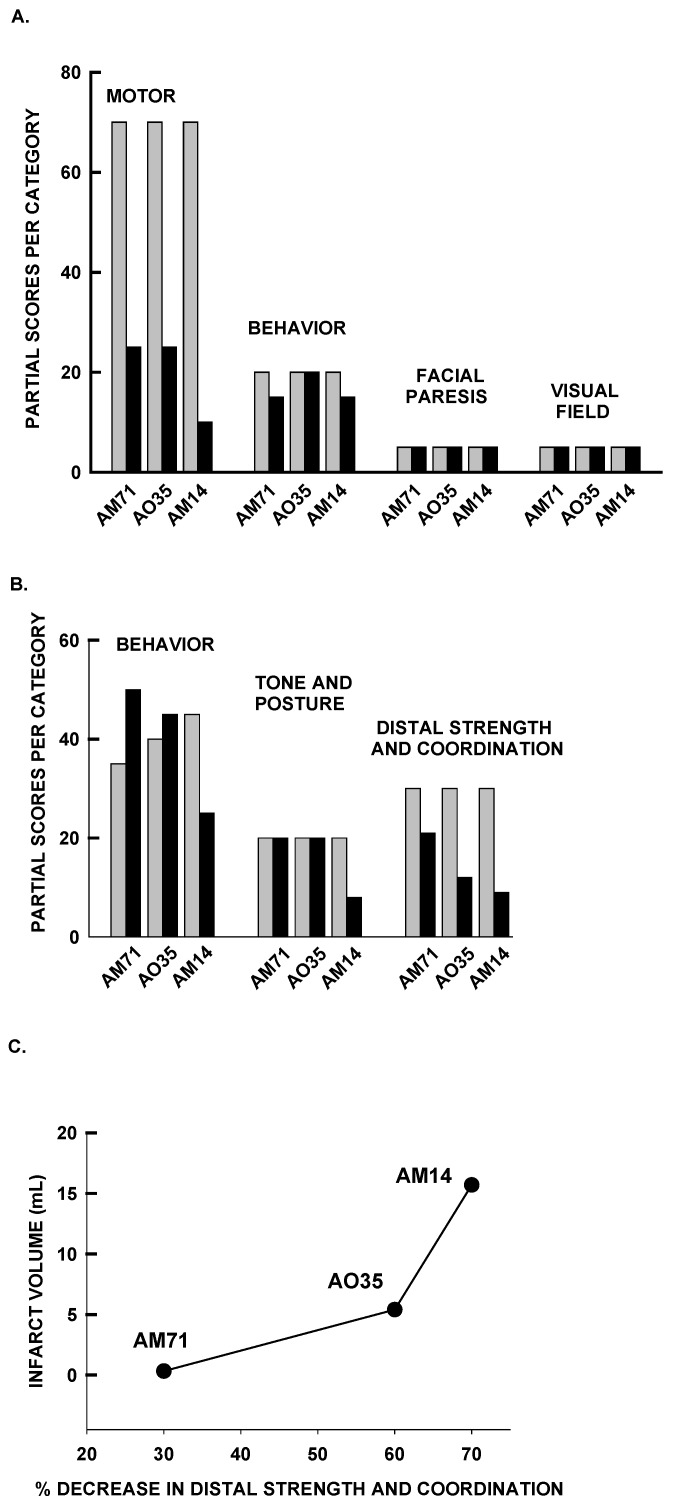
Figure 4.
(A) Behavioral scores obtained by using the Standard Neurologic Scale. The bars represent the partial scores for each category obtained before and after MCAO. (B) Behavioral scores measured by using the Task-oriented Neurologic Scale. The bars represent the scores obtained before and after MCAO. (C) Diffusion-weighted imaging at 24 h after MCAO revealed correlation between infarct volume and neurologic function and the percentage decrease in the Distal Strength and Coordination measures at the same time point.

