
Figure 1.
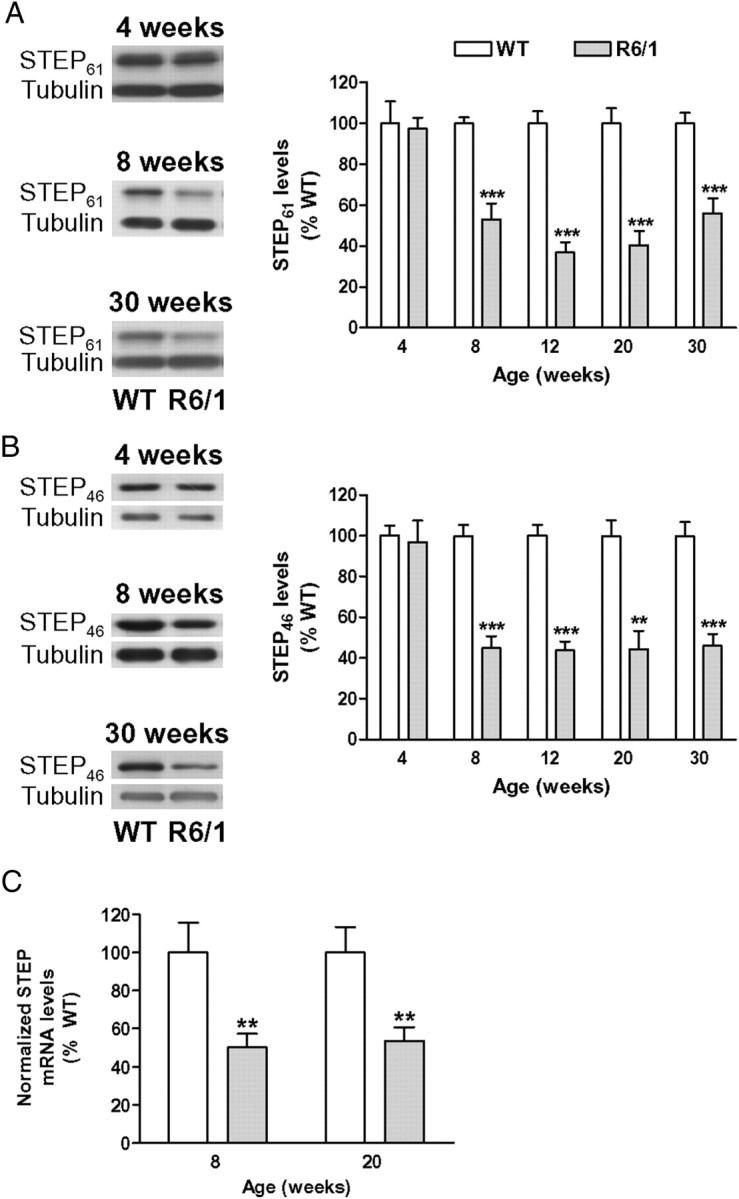
STEP protein and mRNA levels are decreased in the striatum of R6/1 mice. STEP protein levels (A, B) were analyzed by Western blot of protein extracts obtained from the striatum of WT and R6/1 mice at different stages of the disease progression (from 4 to 30 weeks of age). A, B, Representative immunoblots show the protein levels of STEP61, STEP46, and α-tubulin in WT and R6/1 mice at 4, 8, and 30 weeks of age. The graphs show the decrease in striatal STEP61 (A) and STEP46 (B) protein levels in R6/1 mice with respect to their littermate controls at different stages of the disease progression. Values (obtained by densitometric analysis of Western blot data) are expressed as percentage of WT mice (STEP61 or STEP46/α-tubulin ratio) and shown as mean ± SEM (n = 9). C, Graph showing STEP mRNA levels analyzed by Q-PCR in the striatum of 8- and 20-week-old WT and R6/1 mice. Results were normalized to the 18S gene expression, expressed as percentage of WT values, and shown as mean ± SEM (n = 5–7 for each genotype). Data were analyzed by Student's t test. **p < 0.01 and ***p < 0.001 compared with WT mice.