
Figure 8.
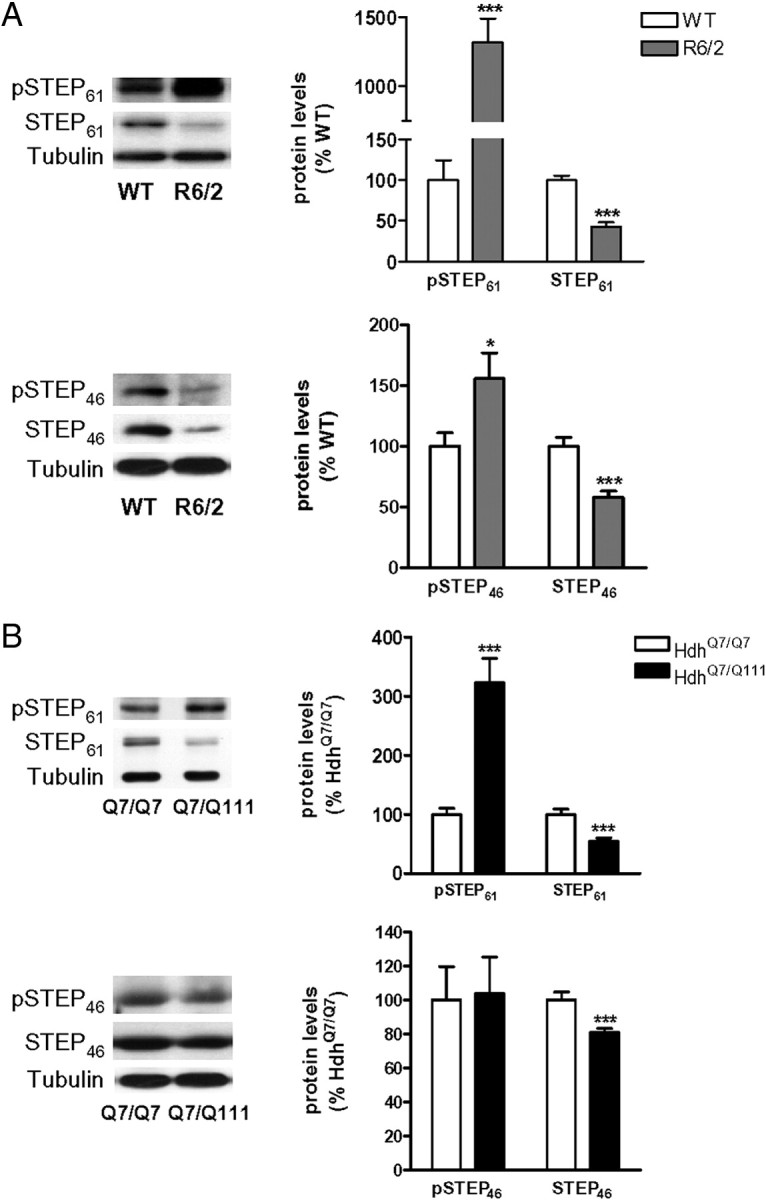
Alterations of STEP and pSTEP levels in the striatum of R6/2 and HdhQ7/Q111 mice. A, B, pSTEP61, pSTEP46, STEP61, and STEP46 levels were analyzed by Western blot of protein extracts obtained from the striatum of WT and R6/2 mice at 12 weeks of age (A) and from 8-month-old HdhQ7/Q7 and knock-in HdhQ7/Q111 mice (B). Representative immunoblots show the protein levels of pSTEP61, pSTEP46, STEP61, STEP46, and α-tubulin in WT, HdhQ7/Q7, R6/2, and HdhQ7/Q111 mice. Values (obtained by densitometric analysis of Western blot data) are expressed as percentage of WT/HdhQ7/Q7 mice (pSTEP/STEP ratio after normalization with α-tubulin and STEP/α-tubulin ratio, respectively) and shown as mean ± SEM (n = 5–8). Data were analyzed by Student's t test. *p < 0.05 and ***p < 0.001 compared with WT or HdhQ7/Q7 mice, respectively.