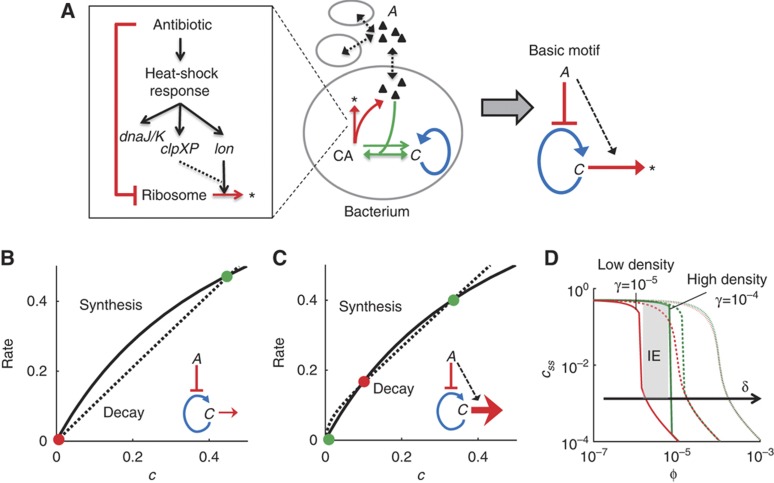
Figure 1.
Antibiotic inhibition of the ribosome can lead to growth bistability. (A) Inhibition of ribosomes (C) by an antibiotic (A). CA represents complex of C and A, and * represents degradation products of C. The model accounts for the positive feedback of C, the transport of A across the bacterial membrane, the binding of A and C, and the degradation of C (left panel). The complex model (middle panel) corresponds to a basic network motif (right panel) that can generate bistability. See Supplementary Figure S1 for additional material. (B) With δ=10−4 (Equation 1), the system has one stable steady state. (C) With δ=10−6 (Equation 1), the system has two stable steady states. Green circles indicate stable steady states. Red circles indicate unstable steady states. The black lines represent the synthesis rate of C (first and second right hand side (RHS) terms of Equation 1). The dotted lines represent the decay and inhibition of C (third RHS term of Equation 1). ϕ=5 × 10⁻⁶ and γ=10−4 (Equation 1). (D) The region of IE shrinks and shifts to higher values of ϕ (antibiotic concentration) with increasing δ (degradation of C). At a high δ (slow degradation of C), a bacterial population would survive or go extinct regardless of its initial density (no IE). At a low δ (fast degradation of C), a bacterial population would exhibit IE (gray area). Red lines represent populations with low initial density (γ=10−5), green lines represent populations with high initial density (γ=10−4). c0=1, α=0.001, κ=0.5, δ=10−6 (full lines), δ=10−5 (dashed lines), and δ=10−4 (dotted lines) (Equation 1).

