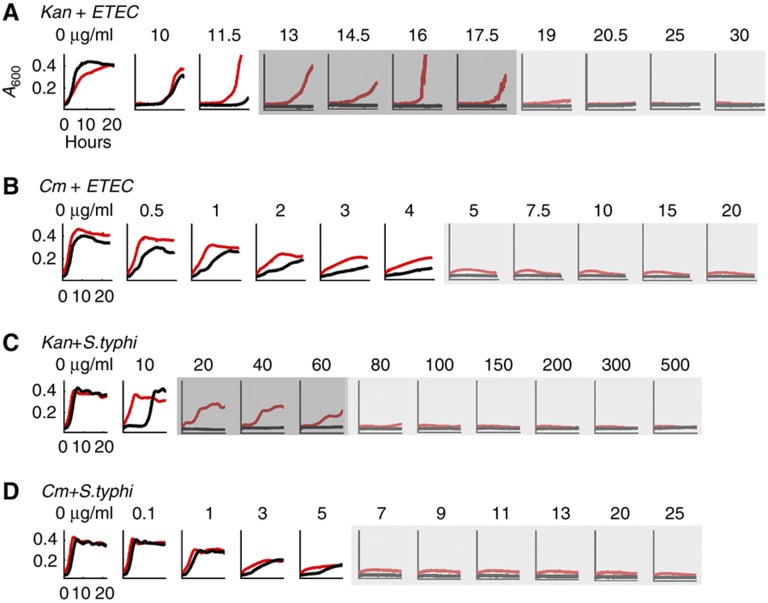
Figure 3.
Kanamycin, but not chloramphenicol, led to IE in enterotoxigenic E. coli (ETEC) and S. typhimurium. (A) ETEC exhibited the inoculum effect at 13–17.5 μg/ml kanamycin. Red and black lines represent high and low initial cell density, respectively. Dark gray regions indicate that populations exhibited IE. Light gray regions indicate that both populations went extinct. (B) ETEC did not exhibit inoculum effect at all tested concentrations of chloramphenicol. (C) S. typhimurium exhibited the inoculum effect at 20–60 μg/ml kanamycin. (D) S. typhimurium did not exhibit inoculum effect at all tested concentrations of chloramphenicol. See additional results in Supplementary Figure S3. Source data is available for this figure in the Supplementary Information.

