Figure 2.
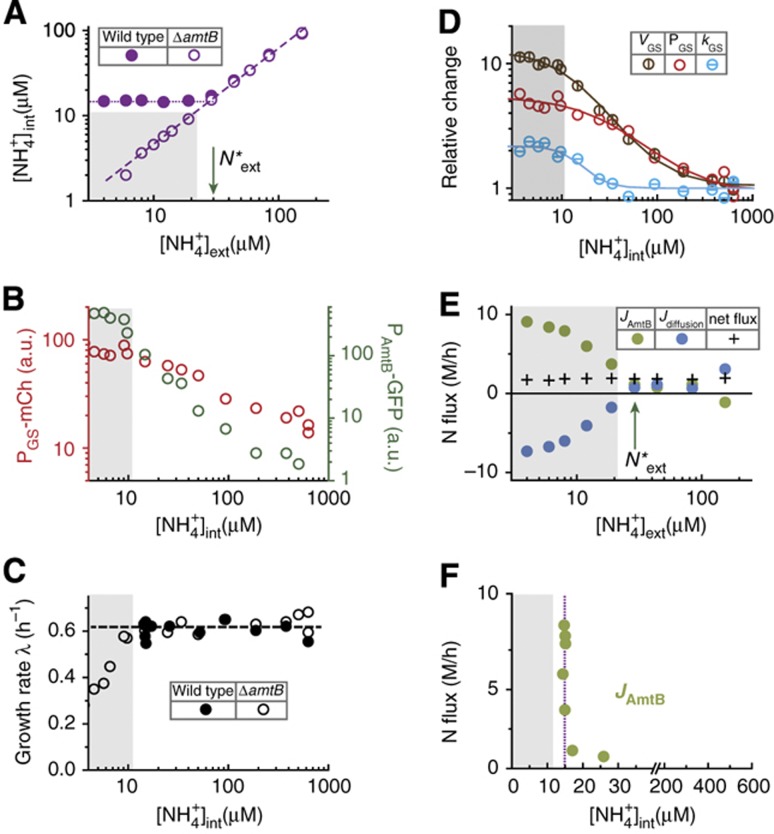
Steady maintenance of internal ammonium and the abrupt activation of AmtB. (A) The deduced internal NH4+ concentrations of the ΔamtB strain (EQ130, open purple circles) and wild type (EQ66, solid purple circles) grown in glycerol with varying NH4+ concentrations; see Equations (1) and (2), and the text. The gray region (defined in Figure 1E) indicates the conditions in which the ΔamtB strain exhibits reduced growth. (B) The dependences of the GS (left axis) and amtB (right axis) promoter activities of the ΔamtB strain on the deduced internal NH4+ concentrations. (C) The growth rate of the ΔamtB strain and wild type on the deduced internal NH4+ concentrations. (D) The Vmax of GS (VGS, brown), the GS expression level (PGS, red) and the specific activity of GS (kGS, cyan) are plotted relative to their values in ammonium-replete conditions. Here, VGS is obtained from Equation (3), and kGS is obtained from the ratio of VGS and PGS. The lines of respective colors are fit using Hill functions (Supplementary Equation S18); see Supplementary Table 4 for the kinetic parameters of the fit. (E) The deduced ammonium transport flux through AmtB (green circles) and the NH3 diffusion flux (blue circles); see Equations (1), (2) and (4). Black crosses represent the net nitrogen influx (the sum of the two fluxes), which the cells utilize for biomass synthesis. Note that the maintenance of the net flux is accompanied by strong increases in ammonium transport by AmtB, and NH3 leakage through passive diffusion. (F) A sharp increase in the ammonium transport flux through AmtB (green circles) when plotted against the deduced internal NH4+ concentrations.

