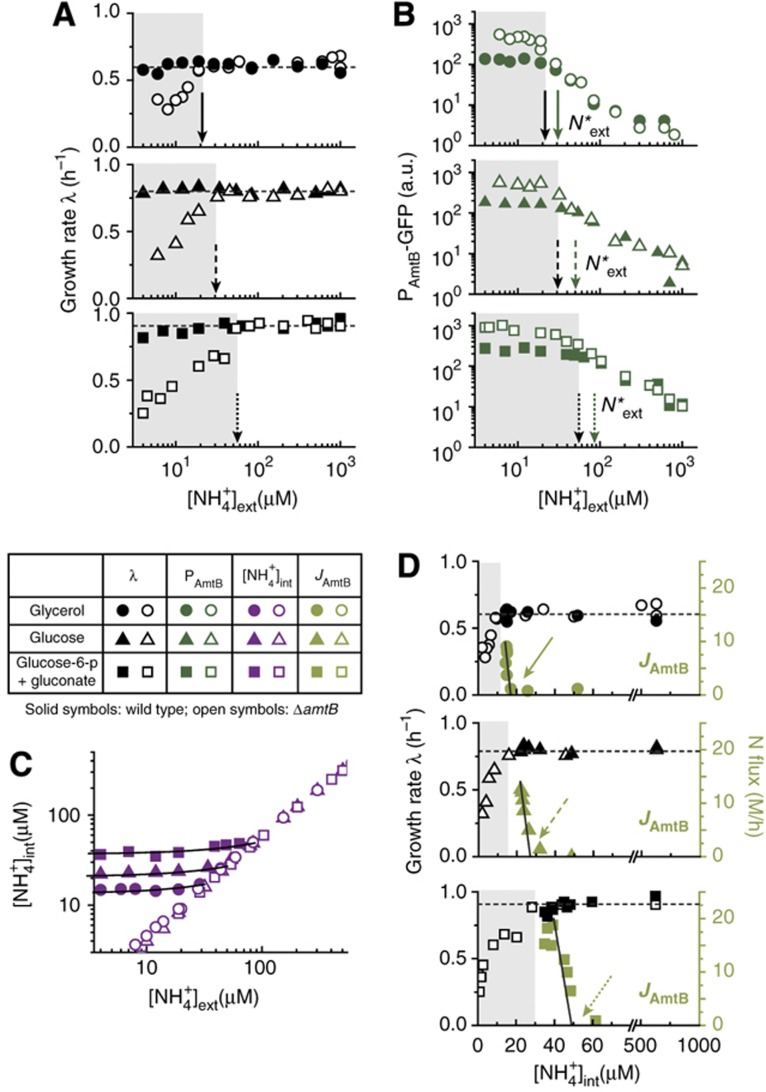
Figure 3.
Coordination of AmtB activity with the cell’s growth status. The growth rate of the culture in ammonium-replete condition was changed by using different carbon sources: glucose-6-phosphate (g6p) plus gluconate (squares), and glucose (triangles). Data from Figures 1 and 2 (glycerol as the carbon source) are re-plotted for comparison (circles). Solid, dashed, and dotted arrows are associated with glycerol, glucose, and g6p plus gluconate. Solid and open symbols indicate the wild-type and ΔamtB strain (EQ66 and EQ130), respectively. (A) The growth rate of the wild-type and ΔamtB strain for all carbon sources tested. The onset of the growth defect of the ΔamtB strain (black arrows) was at successively higher ambient NH4+ concentrations for the carbon sources supporting faster growth. (B) The amtB promoter activities (reported by GFP) of the wild-type and ΔamtB strains deviated (green arrows) at slightly higher ambient NH4+ concentrations than where growth defect set in for the ΔamtB strain (gray zone), indicating that ammonium transport in the wild type occurred barely above where it would be needed to maintain the growth, in coordination with the different growth conditions. (C) The maintenance of the internal NH4+ concentration for the different carbon sources. (D) The growth rate (black symbols) and ammonium transport flux (green symbols) plotted against the internal NH4+ concentrations for the different carbon sources. The abrupt increase in the ammonium flux occurred above the respective onset of growth defect of the ΔamtB strain (right of the gray zone). The black lines in Figures 3C and D show the linear fits of our model (Supplementary Equations S36–S38), from which the onset of AmtB activation N*int is determined (green arrows); see Supplementary Table 5 for the parameters. All the data plotted here are given in Supplementary Tables 8–11. a.u., arbitrary units.

