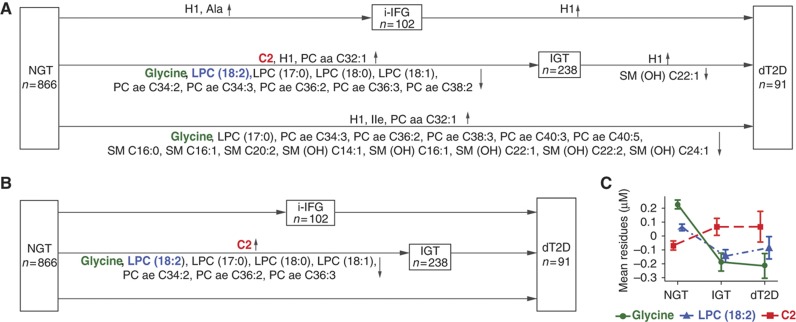
Figure 2.
Differences in metabolite concentrations from cross-sectional analysis of KORA S4. Plots (A, B) show the names of metabolites with significantly different concentrations in multivariate logistic regression analyses (after the Bonferroni correction for multiple testing with P<3.6 × 10⁻⁴) in the five pairwise comparisons of model 1 and model 2. Plot (C) shows the average residues of the concentrations with standard errors of the three metabolites (glycine, LPC (18:2) and acetylcarnitine C2) for the NGT, IGT and dT2D groups. Plot (A) shows the results with adjustment for model 1 (age, sex, BMI, physical activity, alcohol intake, smoking, systolic BP and HDL cholesterol), whereas plots (B, C) have additional adjustments for HbA1c, fasting glucose and fasting insulin (model 2). Residuals were calculated from linear regression model (formula: T2D status∼metabolite concentration+model 2). For further information, see Supplementary Table S4.

