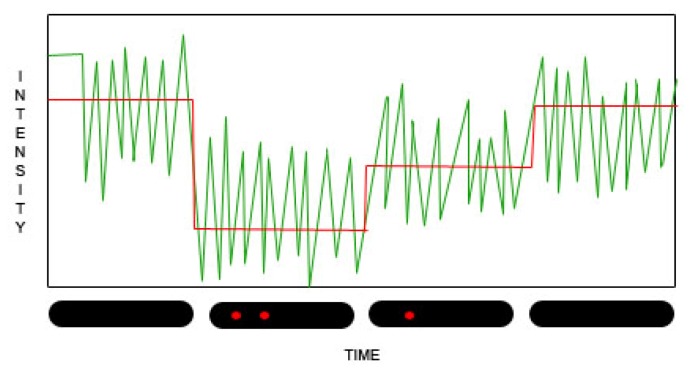
Figure 2.
Stepwise quenching of nanotube fluorescence Fluorescent intensity measurements (gray) indicate the transitions between quenching states, as redox mediators partially draw away and release electrons back to the nanotube. These can be converted using a variety of algorithms into a stepwise representation of nanotube fluorescence dynamics (black) indicating the association with or dissociation of single molecules from the nanotube’s surface, as depicted below the graph.

