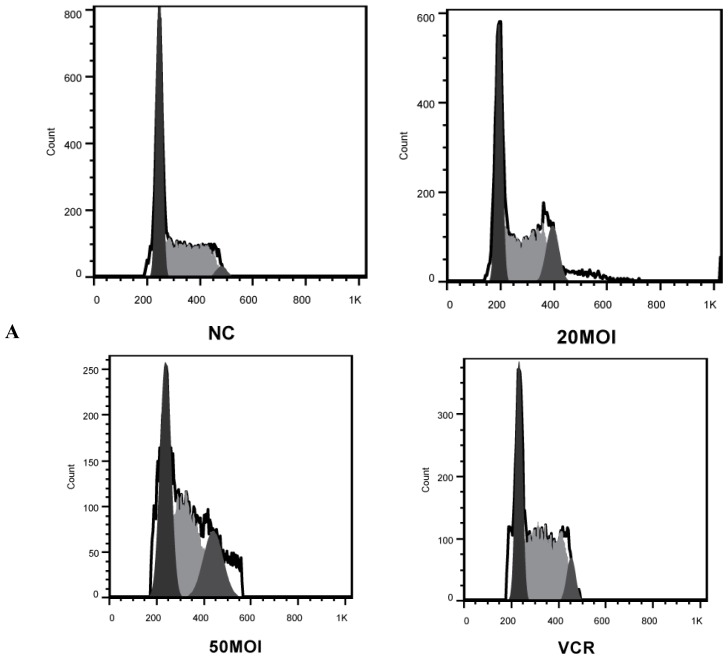
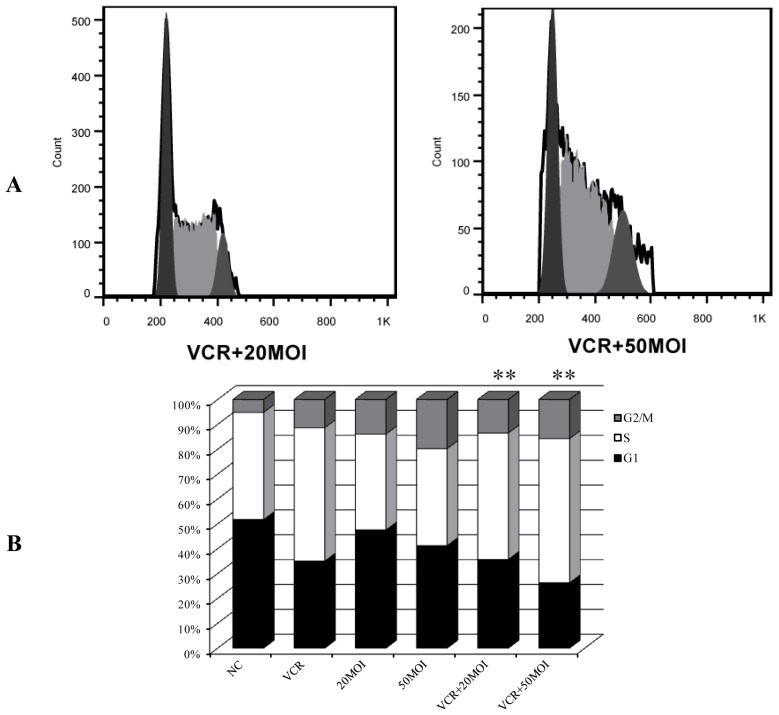
Figure 3.
Representative FACS histograms showing the cell cycle distribution in HXO-RB44 cells following different treatments. (A) Cell cycle analysis was performed by quantifying propidium iodide (PI) incorporation by flow cytometry. DNA content and number of events were analyzed after different treatments for 48 h; (B) relative changes in the percentage in each cell cycle phase were plotted after PI staining and FACS analysis. Results are representative of three independent experiments (** p < 0.01, compared with S and G2/M phases of HXO-RB44 treated with 5 nM VCR). NC (negative control): treatment with PBS.


