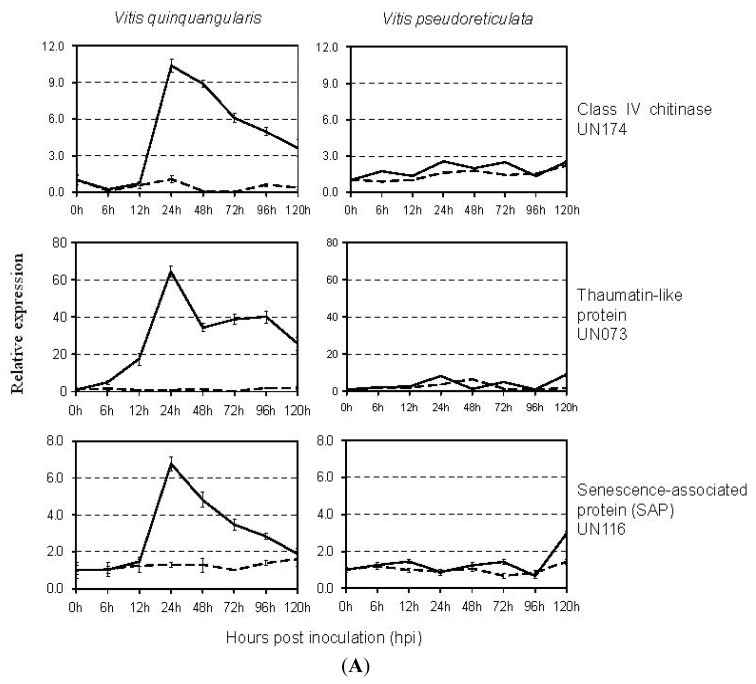
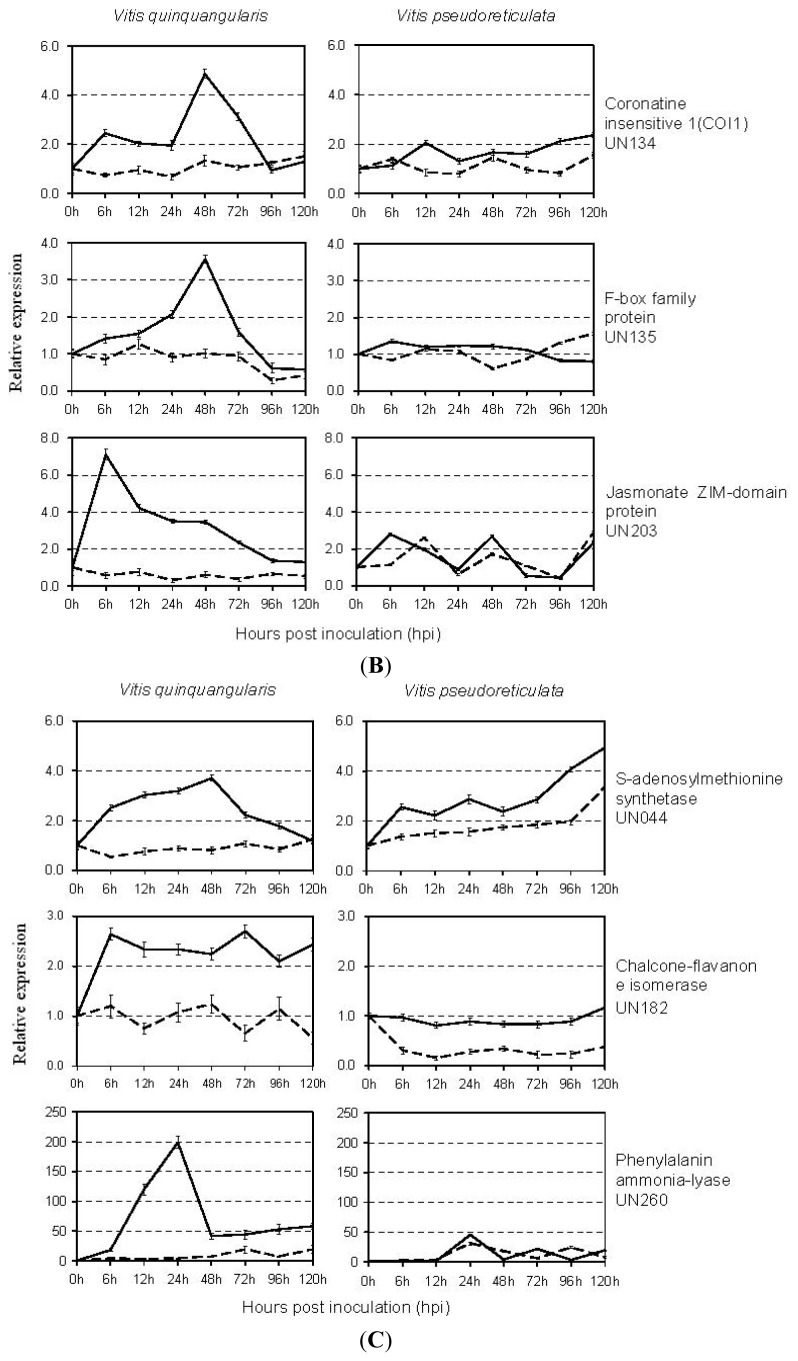
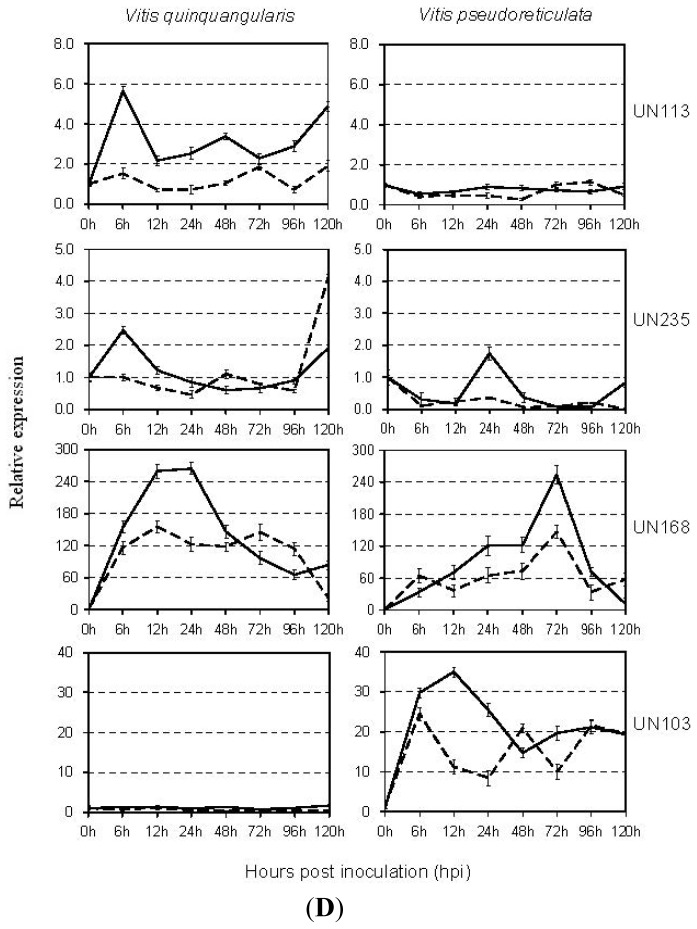
Figure 4.
Real-time quantitative RT-PCR analysis of transcript accumulation in two grapevine genotypes in response to E. necator at 0, 6, 12, 24, 48, 72, 96, and 120 hpi. Data represents means of triplicate data. Expression profiles of genes in the disease/defense category (A); genes involved in Ubiquitin/26S proteasome pathway (B); genes in the metabolism category (C); and genes with no known homologs (D) are shown. Solid line, E. necator-inoculated samples; dashed line, mock-inoculated samples.


