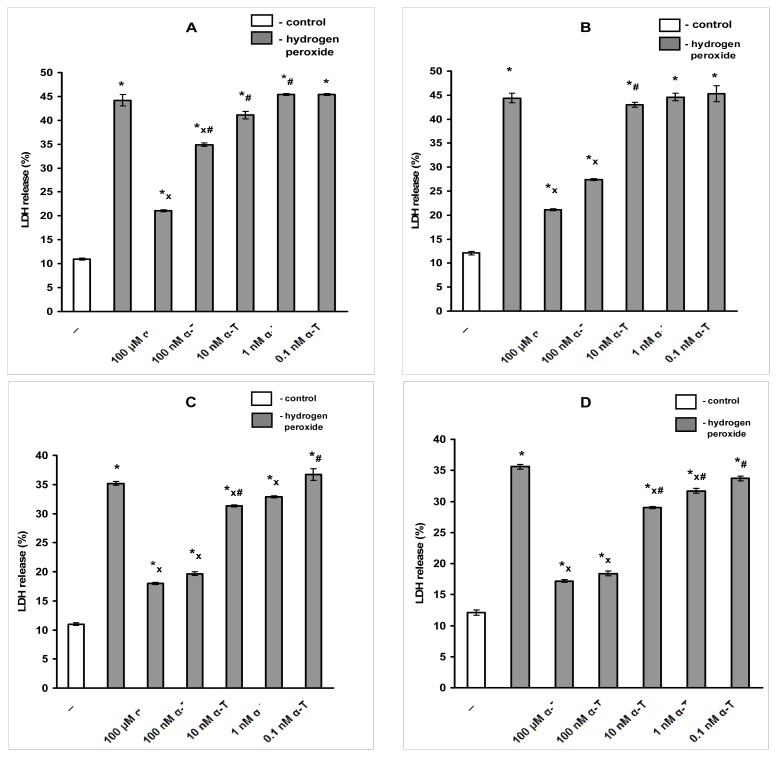
Figure 2.
The figure provides evidence that the marked protective effect of 100 nM α-T is revealed when pre-incubation of PC12 cells with it is performed for 3–18 h, prior to the exposure to H2O2. In this figure, the results of one typical experiment (from four replicates) are presented as means ± SEM of 2–3 parallel determinations. PC12 cells were pre-incubated for 3 h (A); 6 h (B); 12 h (C) or 18 h (D) with α-T and then exposed to 0.2 mM H2O2 for 24 h. The differences are significant by one-way ANOVA followed by Tukey’s multiple comparison test: * as compared to control values, p < 0.01; x as compared to the effect of H2O2 alone, p < 0.05; # as compared to the effect of α-T at all higher concentrations, p < 0.05.

